Navigation

- Home |
- Gallery |
- API Docs »
- wx.lib »
- wx.lib.plot »
- wx.lib.plot.examples »
- wx.lib.plot.examples.demo »
- wx.lib.plot.examples.demo.PlotDemoMainFrame
- index
- modules |
- next |
- previous |

 wx.lib.plot.examples.demo.PlotDemoMainFrame
 Methods Summary
 Class API
PlotDemoMainFrame(wx.Frame)¶__init__(self, parent, wxid, title)¶DrawPointLabel(self, dc, mDataDict)¶This is the fuction that defines how the pointLabels are plotted
| Parameters: |
|
|---|
As an example I have decided I want a box at the curve point with some text information about the curve plotted below. Any wxDC method can be used.
OnAbsX(self, event)¶OnAbsY(self, event)¶OnBackgroundGray(self, event)¶OnBackgroundWhite(self, event)¶OnEnableAntiAliasing(self, event)¶OnEnableAxesAll(self, event)¶OnEnableAxesBottom(self, event)¶OnEnableAxesBottomLeft(self, event)¶OnEnableAxesLabels(self, event)¶OnEnableAxesLeft(self, event)¶OnEnableAxesRight(self, event)¶OnEnableAxesTop(self, event)¶OnEnableAxesValuesBottom(self, event)¶OnEnableAxesValuesLeft(self, event)¶OnEnableAxesValuesRight(self, event)¶OnEnableAxesValuesTop(self, event)¶OnEnableCenterLines(self, event)¶OnEnableDiagonals(self, event)¶OnEnableDrag(self, event)¶OnEnableGridAll(self, event)¶OnEnableGridX(self, event)¶OnEnableGridY(self, event)¶OnEnableHiRes(self, event)¶OnEnableLegend(self, event)¶OnEnablePlotTitle(self, event)¶OnEnablePointLabel(self, event)¶OnEnableTicksBottom(self, event)¶OnEnableTicksLeft(self, event)¶OnEnableTicksRight(self, event)¶OnEnableTicksTop(self, event)¶OnEnableZoom(self, event)¶OnFileExit(self, event)¶OnFilePageSetup(self, event)¶OnFilePrint(self, event)¶OnFilePrintPreview(self, event)¶OnForegroundBlack(self, event)¶OnForegroundRed(self, event)¶OnHelpAbout(self, event)¶OnLogX(self, event)¶OnLogY(self, event)¶OnMotion(self, event)¶OnMouseLeftDown(self, event)¶OnPlotClear(self, event)¶OnPlotDraw1(self, event)¶Sin, Cos, and Points
OnPlotDraw10(self, event)¶Bar Chart example
OnPlotDraw2(self, event)¶Sin, Cos, Points, and lines between points
OnPlotDraw3(self, event)¶Various Marker Types
OnPlotDraw4(self, event)¶25,000 point line and markers
OnPlotDraw5(self, event)¶Empty plot with just axes
OnPlotDraw6(self, event)¶Bar Graph Example
OnPlotDraw7(self, event)¶log scale example
OnPlotDraw8(self, event)¶Box Plot example
OnPlotDraw9(self, event)¶Histogram example
OnPlotRedraw(self, event)¶OnPlotScale(self, event)¶OnReset(self, event)¶OnSaveFile(self, event)¶OnScrRt(self, event)¶OnScrUp(self, event)¶resetDefaults(self)¶Just to reset the fonts back to the PlotCanvas defaults


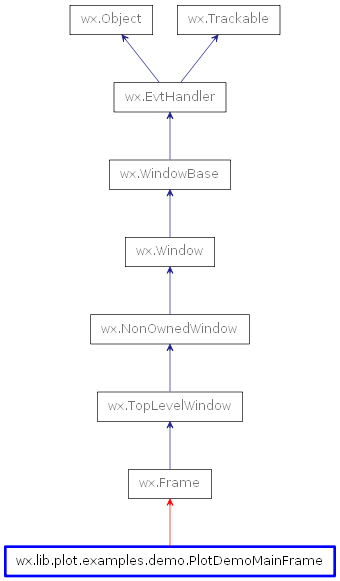
 Inheritance diagram for class PlotDemoMainFrame: