Welcome to svgis’s documentation!
Create SVG drawings from vector geodata files (SHP, geoJSON, etc).
SVGIS is a command line tool for creating many small maps. It’s designed to fit well with the Unix toolkit, and play nicely in a workflow, e.g. Makefile.
It also excels at basic maps that can be later elaborated in a drawing program (e.g. Illustrator).
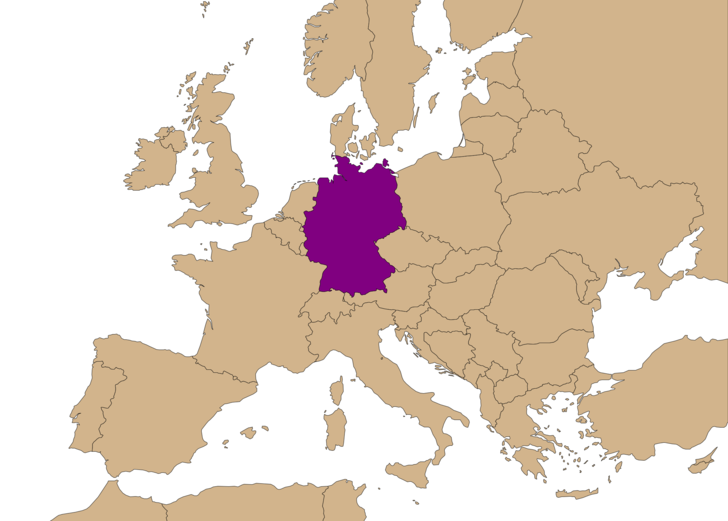
With SVGIS, a command like this:
svgis draw ne_10m_admin_0_countries.shp \
--bounds -13 35 35 62 \
--project EPSG:102013 \
--scale 1000 \
--id-field name \
--style ".ne_10m_admin_0_countries {fill: tan;} .Germany { fill: purple }" \
Generates a map like this:
SVGIS is built on top of GDAL/OGR, so it can read just about any geodata file format you throw at it.
This documentation assumes some familiarity with CSS, how map projections work, assumes you have some geodata at your disposal. If you don’t know where to find geodata, Natural Earth is a great place to start.