References :
- source : https://github.com/jul/pypi-stat/
- online documentation : http://pypi-stat.readthedocs.org/
- ticketing : https://github.com/jul/pypi-stat/issues
Synopsis
Pypi offers an xmlrpc service that can gives you once a day the download stats for your package. The problem is that for ploting a time serie you need the past datas. This package is made of two scripts :
- one to gather the data and store them in json format ;
- one to plot the results as a time serie.
pypi_get_stat to fetch data
Stats are fetched on pypi. It is based on http://www.codekoala.com/blog/2010/pypi-download-stats/
This scripts add to the original the usage and storing previous stats in ~/.pypi.stat.json
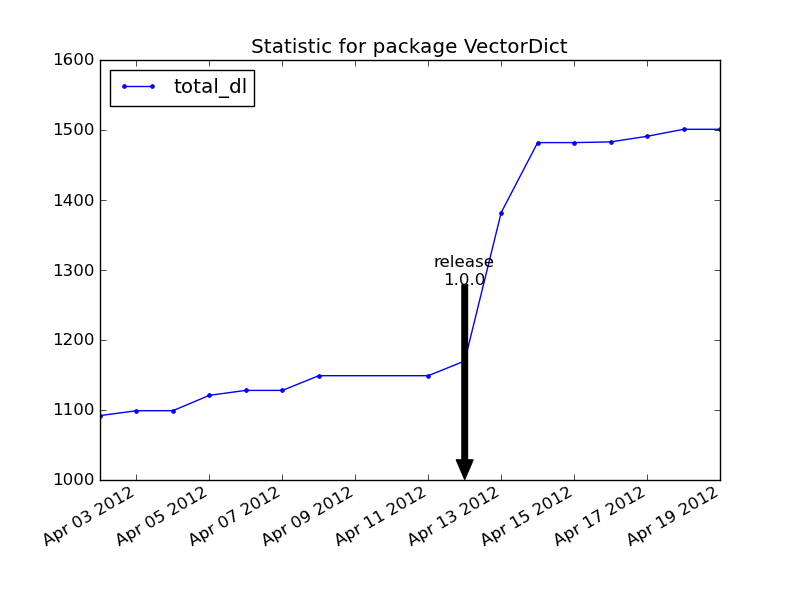
pypi_graph_stat to plot the stats
- Based on the stored stats, use matplotlib :
- either to make a plot in matplotlib (it should pop a TK window with the graph);
- or print a plot in a mentioned file.
- It has limited query feature :
- date interval can be specified ;
- package to plot ;
- keys in the fetched stat to plot (total download, average download, minimum download per release, maximum download per release);
- release dates are added;
Example
QuickStart
Install following Installation
get stats for a package (here we want download stats for numpy).
pypi_get_stat.py numpy
graph all known packages in the stored stats.
pypi_graph_stat.py
Using pypi-stat
Contents: