Back to Guide
Visualization
Every class in pyny3d has, at least, one way to be visualized: the
.plot() method. In addition, there are other methods that allow for
different kinds of representations.
Again, we will use this geometry as example:
import numpy as np
import pyny3d.geoms as pyny

# Declaring the geometry
## Surface
poly_surf = [np.array([[0,0,0], [7,0,0], [7,10,2], [0,10,2]]),
             np.array([[0,10,2], [7,10,2], [3,15,3.5]]),
             np.array([[0,10,2], [3,15,3.5], [0,15,3.5]]),
             np.array([[7,10,2], [15,10,2], [15,15,3.5], [3,15,3.5]])]

## Obstacles
wall_1 = np.array([[0,0,4], [0.25,0,4], [0.25,15,4], [0,15,4]])
wall_2 = np.array([[0,14.7,5], [15,14.7,5], [15,15,5], [0,15,5]])
chimney = np.array([[4,0,7], [7,0,5], [7,3,5], [4,3,7]])

# Building the solution
place = pyny.Place(poly_surf_0, melt=True)
place.add_extruded_obstacles([wall_1, wall_2, chimney])
place.mesh(0.5)

# Viz
place.iplot(c_poly='b')

plot
This is the most simple visualization tool: it represents an object in 3D. Its only argument to control the representation is color, and what it does is pretty simple and intuitive.
As color, it is possible to indicate any kind of color that matplotlib accepts plus a new option: ‘t’ for transparent. Indeed, transparent is the color by default because, as you probably know already, matplotlib has serious problems identifying what is in front or behind in 3D representations.
One interesting capability of .plot() is that you can easily use it as a
part in bigger processes (primarily loops) making plots in cascade thanks to
its ret and ax arguments:
- ret: If True, returns the figure.
- ax: Whatever you want to represent will be on top of the ax axes.
In the PiP and Classify tutorial you can see some examples of ret usage.
iplot
iplot is an improved version of plot that allows to plot polygons, holes and points in different colors. Due to neither Polygon nor Polyhedron classes have anything different than polygons, these classes do not have this method.
An example for Surface:
In [1]: place.surface.iplot()
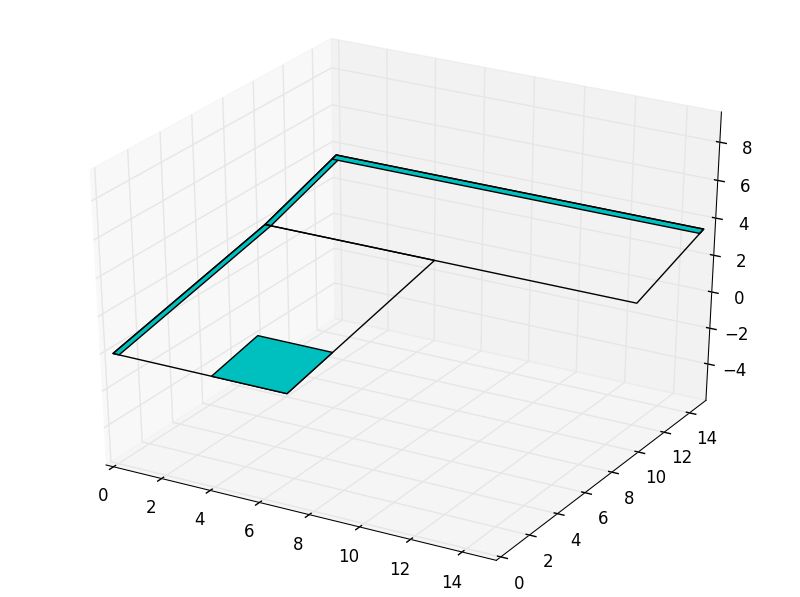
By default, Polygons are represented in transparent (c_poly=’t’) and holes in cyan (c_holes=’c’). Due to the matplotlib 3D representation overlapping problems it is a good solution repersent the bigger things in transparent and the smaller in color. Surface has no Set of Points associated, so iplot does not have arguments for them here.
An example for Space:
In [2]: place.iplot(c_poly='t', c_holes='g', s_sop=60, c_sop='k')

Finally, it is important to remark that iplot also have the ret and ax options.
plot2d
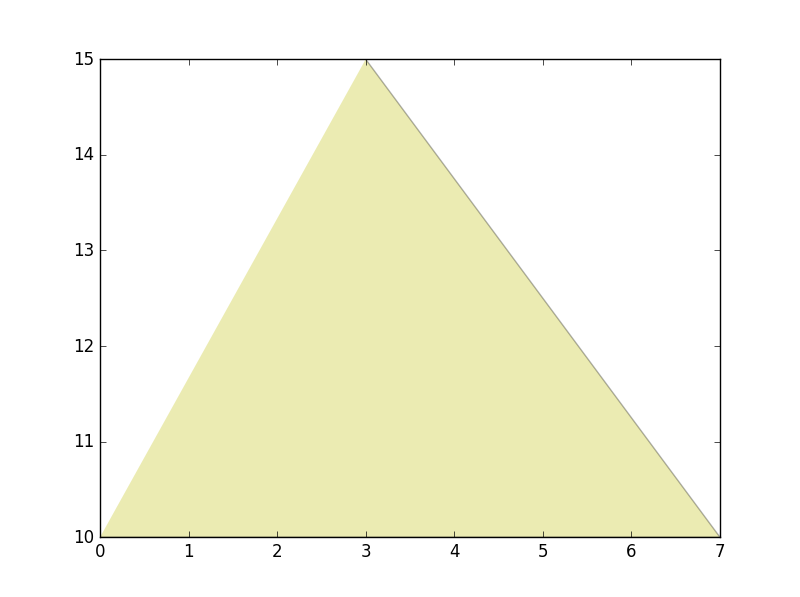
Only Polygon and Surface classes have this method. With it, we can visualize coloured z=0 projections of the objects. In the case of Polygons, the color can be only one but, for Surfaces, it is possible to introduce color scales and request a colorbar in the result. For both classes, it is possible to set some grade of transparency through the alpha argument.
For Polygons:
In [3]: polygon = place.surface[-1]
   ...: polygon.plot2d('y', alpha=0.3)
   ...:
For Surfaces:
In [4]: place.surface.plot2d() # plot by default
   ...: color_scale = np.arange(len(place.surface.polygons))
   ...: import matplotlib.cm as cm
   ...: color_map = cm.rainbow
   ...: place.surface.plot2d(c_poly=color_scale, alpha=0.7, cmap=color_map, colorbar=True)  # coloured plot
   ...:

This method was created to make visualizations like this in the shadows module, using the generated information from the shading simulations:

Next tutorial: Transformations