Back to Guide
Advanced shading tutorial
In this section we are going to see how to tune up the simulation parameters manually and how to project real time series over the pyny3d models. As usually, we are going to use the same basic geometry for the examples:
import numpy as np
import pyny3d.geoms as pyny

# Declaring the geometry
## Surface
poly_surf_0 = [np.array([[0,0,0], [7,0,0], [7,10,2], [0,10,2]]),
               np.array([[0,10,2], [7,10,2], [3,15,3.5]]),
               np.array([[0,10,2], [3,15,3.5], [0,15,3.5]]),
               np.array([[7,10,2], [15,10,2], [15,15,3.5], [3,15,3.5]])]
poly_surf_1 = [np.array([[8,0,0], [15,0,0], [15,9,0], [8,9,0]])]

## Obstacles
wall_1 = np.array([[0,0,4], [0.25,0,4], [0.25,15,4], [0,15,4]])
wall_2 = np.array([[0,14.7,5], [15,14.7,5], [15,15,5], [0,15,5]])
chimney = np.array([[4,0,7], [7,0,5], [7,3,5], [4,3,7]])

# Building the solution
place_0 = pyny.Place(poly_surf_0, melt=True)
place_0.add_extruded_obstacles([wall_1, wall_2, chimney])
place_1 = pyny.Place(poly_surf_1)
space = pyny.Space([place_0, place_1])

# Viz
space.iplot(c_poly='b')
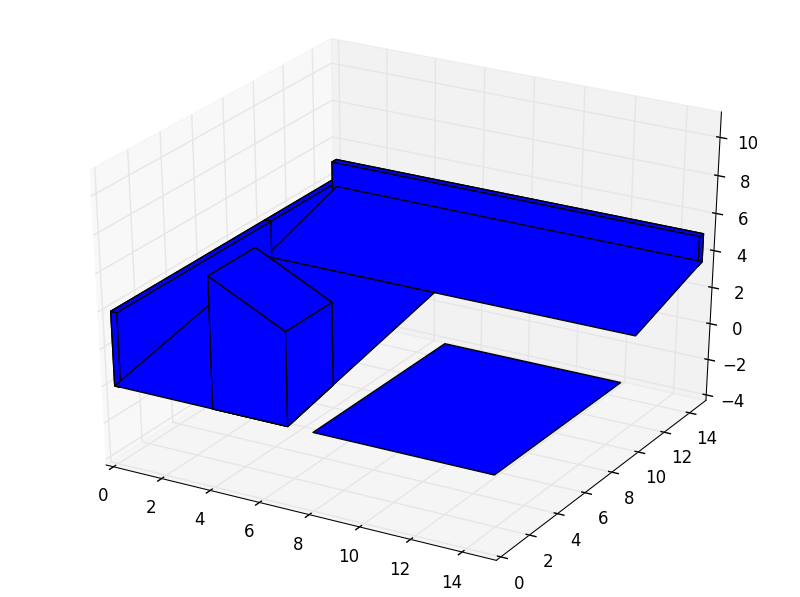
In the next subsections we will see one example of each parameter and its implications. But first, we are going to initialize an empty ShadowsManager for the space:
In [1]: S = space.shadows() # by default, init='empty'
Parameters
Sensible points
The easier way to put a set of points on the Space is directly
by the pyny.Space.mesh() method but, as an example, we are going to declare
a set of points externally. In this case, I am going to generate a set of
random points given by its (x, y) coordinates, compute their correspondant
heights and add an extra random height:
In [2]: xy = np.random.rand(1000, 2)*15
   ...: xyz = space.get_height(xy)
   ...: xyz[:, 2] += np.random.rand(1000)*2
   ...: not_nan = np.logical_not(np.isnan(xyz[:, 2]))
   ...: xyz = xyz[not_nan,:]
   ...:
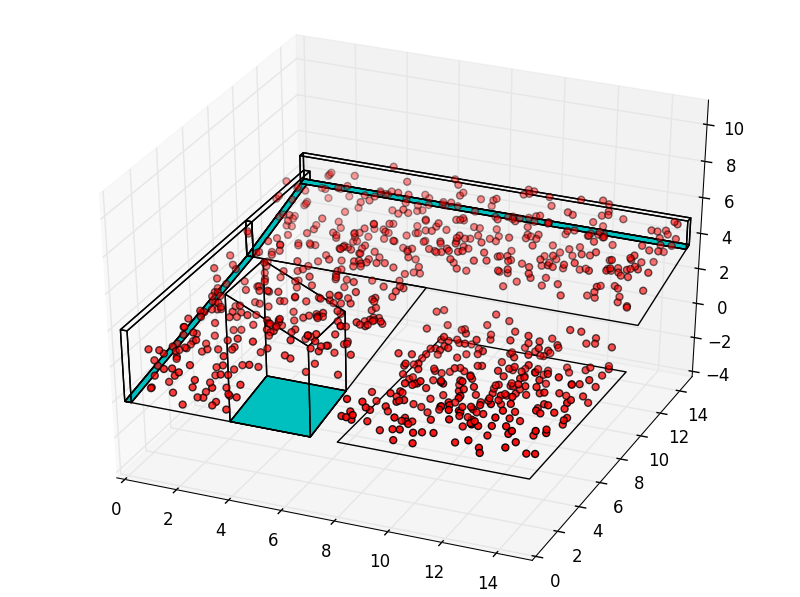
Remember that a pyny.Space cannot store points (Spaces are only collections of Places), instead we have to choose one way to input the points to the model. The easiest (what we are going to do) is to store all of them in one single Place, but if we want to keep the real correspondance between each point and the Place where it belgons we could be use the same code written before but, in this case, in a loop which separates the Places where we compute the height. The short way:
In [3]: S.space[0].add_set_of_points(xyz)
   ...: S.space.iplot()
   ...:
time vector
It is possible to set your own time vector for the shading simulations in pyny3d, which can be irregular spaced. As you already know, these vectors can be easily auto-generated by giving an interval dt (in minutes) but, for simulations with real data, it is better to personally specify it. Indeed, most of the time you will use the time vector that is already in your data’s csv file.
As we saw in previous sections, the time vector have to be in “absolute” minutes, that is, the first interval is the Jan 1 00:00 [0] and the last is Dec 31 23:59 [525599]. So, to create a half-hour spaced time vector you only need to write:
In [4]: t.shape
Out[4]: (17520,)
In addition, you can insert the time vector as a list of datetime objects. It is important to remark that it must be a list, not a ndarray.
I am going to make this example through this last possiblity for a city in the South of Spain, Granada. I will use pandas for the csv loading but you can use whatever tool you prefer.
In [5]: import pandas as pd

In [6]: data = pd.read_csv('data.csv')
   ...: data.head(20)
   ...:
Out[6]:
                   date  irradiation  electric_load
0   2012-01-01 00:00:00         0.00    8719.641552
1   2012-01-01 00:30:00         0.00    7912.491993
2   2012-01-01 01:00:00         0.00    6028.565328
3   2012-01-01 01:30:00         0.00    4521.423996
4   2012-01-01 02:00:00         0.00    3767.853330
5   2012-01-01 02:30:00         0.00    3014.282664
6   2012-01-01 03:00:00         0.00    3014.282664
7   2012-01-01 03:30:00         0.00    3014.282664
8   2012-01-01 04:00:00         0.00    3014.282664
9   2012-01-01 04:30:00         0.00    3014.282664
10  2012-01-01 05:00:00         0.00    3014.282664
11  2012-01-01 05:30:00         0.00    3014.282664
12  2012-01-01 06:00:00         0.00    3202.675330
13  2012-01-01 06:30:00         0.00    3391.067997
14  2012-01-01 07:00:00         0.00    3579.460663
15  2012-01-01 07:30:00         0.21    3767.853330
16  2012-01-01 08:00:00         8.70    3956.245996
17  2012-01-01 08:30:00        93.90    4333.031329
18  2012-01-01 09:00:00       178.30    4709.816662
19  2012-01-01 09:30:00       242.60    5274.994662
The units for the irradiation are W/m2 and for the electric load, W. The next step is to declare the vectors: for this case we have one time vector and two data vectors.
In [7]: from datetime import datetime as dt

In [8]: t = [dt.strptime(date, "%Y-%m-%d %H:%M:%S") for date in data['date']]

In [9]: t[0]
Out[9]: datetime.datetime(2012, 1, 1, 0, 0)

In [10]: t[-1]
Out[10]: datetime.datetime(2012, 12, 30, 23, 30)
And, finally, we set the simulation time:
In [11]: S.arg_t = t
Warning
2012 is a leap-year so I have omitted the last day instead of removing a middle-day in order to respect the data continuity.
data
Probably the most important one; without real data, the simulations would be almost useless. Having done the previous step, this one is trivial:
In [12]: S.arg_data = data['irradiation'].values
dt
It is not necessary because we have already declared the time vector, so we do
not have to generate it. In other case, it would be enough just to code
S.arg_dt = 30 to tell to the program that it has to create the same vector
that we manually created in the ipython’s In [2] above.
vor_size
This parameter refers to the Voronoi discretization mesh size in radians. The smaller, the more polygons we obtain, the more precise the simulation is but the slower it becames. As always, it depends of the relation between speed and accuracy you want.
In [14]: S.arg_vor_size = np.deg2rad(5) # 5º for the side of the squares
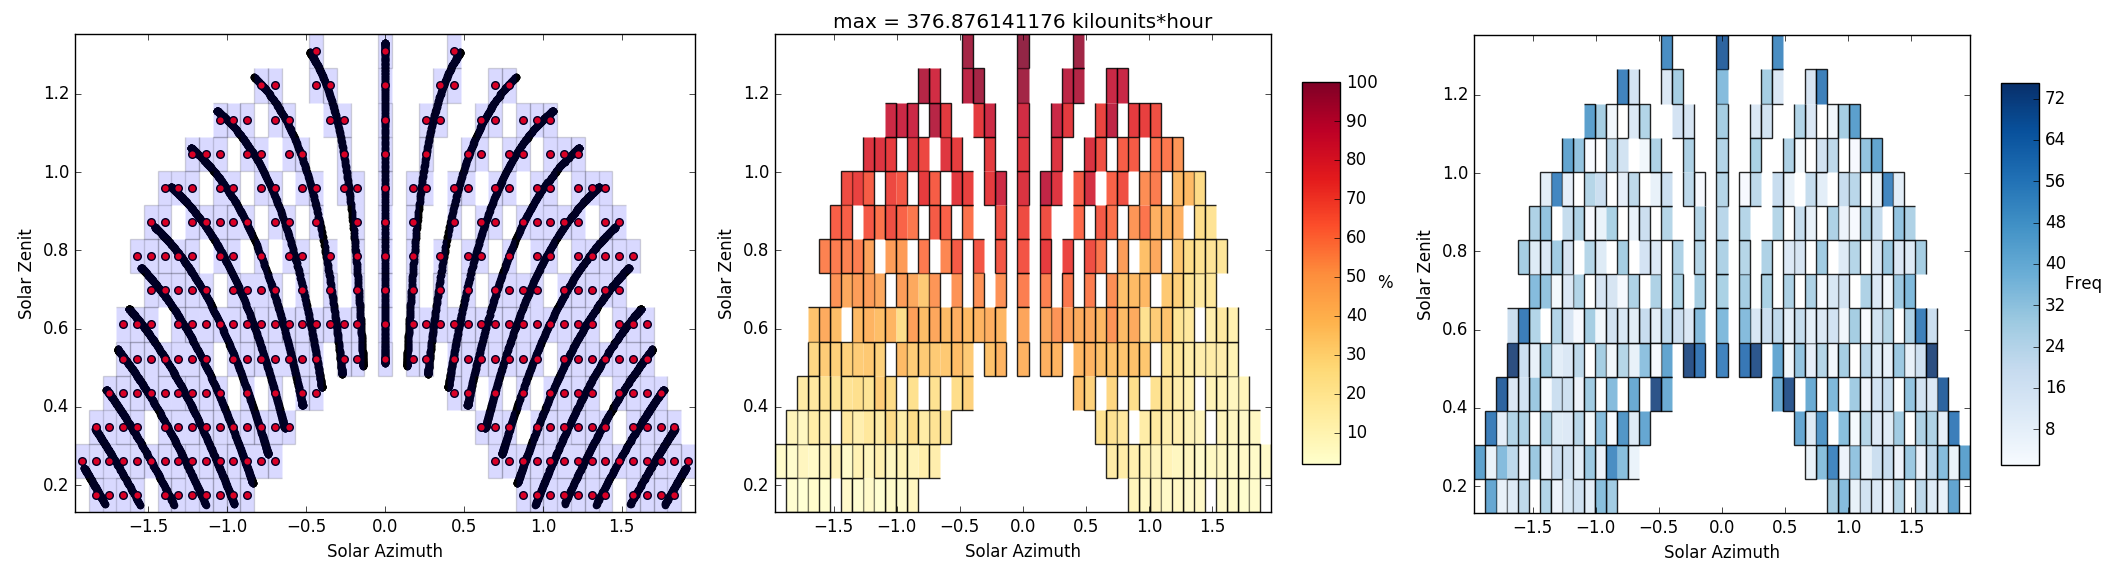
Results
Now that everything is set up, it is time to run the simulation and to generate the visualizations:
In [17]: S.run()
    ...: S.viz.exposure_plot()

In [18]: S.viz.vor_plot('vor')
    ...: S.viz.vor_plot('data')
    ...: S.viz.vor_plot('freq')
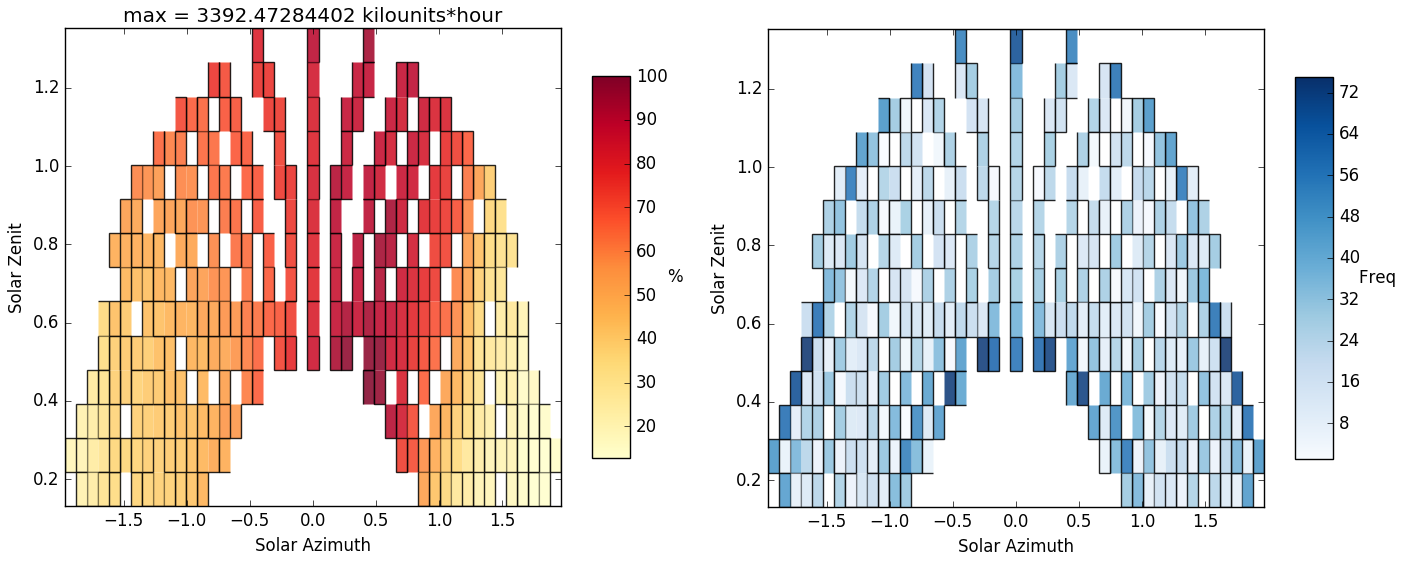
For the other data series, the electric loads:
In [19]: S.arg_data = data['electric_load'].values

In [20]: S.run()
    ...: S.viz.exposure_plot()

In [21]: S.viz.vor_plot('data')
    ...: S.viz.vor_plot('freq')
Finally, as summary, here you are the entire code for one simulation:
# ShadowsManager
S = space.shadows()

## Points
xy = np.random.rand(1000, 2)*15
xyz = S.space.get_height(xy)
xyz[:, 2] += np.random.rand(1000)*2
not_nan = np.logical_not(np.isnan(xyz[:, 2]))
xyz = xyz[not_nan,:]
S.space[0].add_set_of_points(xyz)

## Data
data = pd.read_csv('data.csv')
t = [dt.strptime(date, "%Y-%m-%d %H:%M:%S") for date in data['date']]

## Parameters
S.arg_t = t
S.arg_data = data['irradiation'].values
S.arg_latitude = np.deg2rad(37.17946)
S.arg_vor_size = np.deg2rad(5)
S.arg_zenitmin = 0.15
S.arg_longitude = np.deg2rad(-3.6079)
S.arg_UTC = +1
S.arg_run_true_time = True

## Run
S.run()

## Viz
S.viz.exposure_plot()
S.viz.vor_plot('vor')
S.viz.vor_plot('data')
S.viz.vor_plot('freq')