Misc Examples
Example - Using pyKML to visualize ephemeris data
The following example demonstrates how pyKML can be used visualize geospatial data generated by another Python library, PyEphem, which computes the positions of astronomical objects for locations on the earth surface at specific points in time. The script below uses pyKML to generate a KML file that shows solar ephemeris data for an observer at Stonehenge during the winter solstice.
The KML document contains a series of folders corresponding to various times throughout the day on the winter solstice. Within each folder, you can click on either the observer placemark (symbolized with a sphere) or the Sun View placemark to adjust the viewpoint. Note that many of the objects contain timestamp elements, so you may need to adjust Google Earth’s time slider in order to view the objects.
Note that the KML refers to an external 3-D model file. Download the 3-D model file into the same folder as the KML file.
Downloads:
- pyKML script: pyephem_example.py
- KML output: stonehenge_example_output.kml
- 3-D model: unit_cone_red.dae
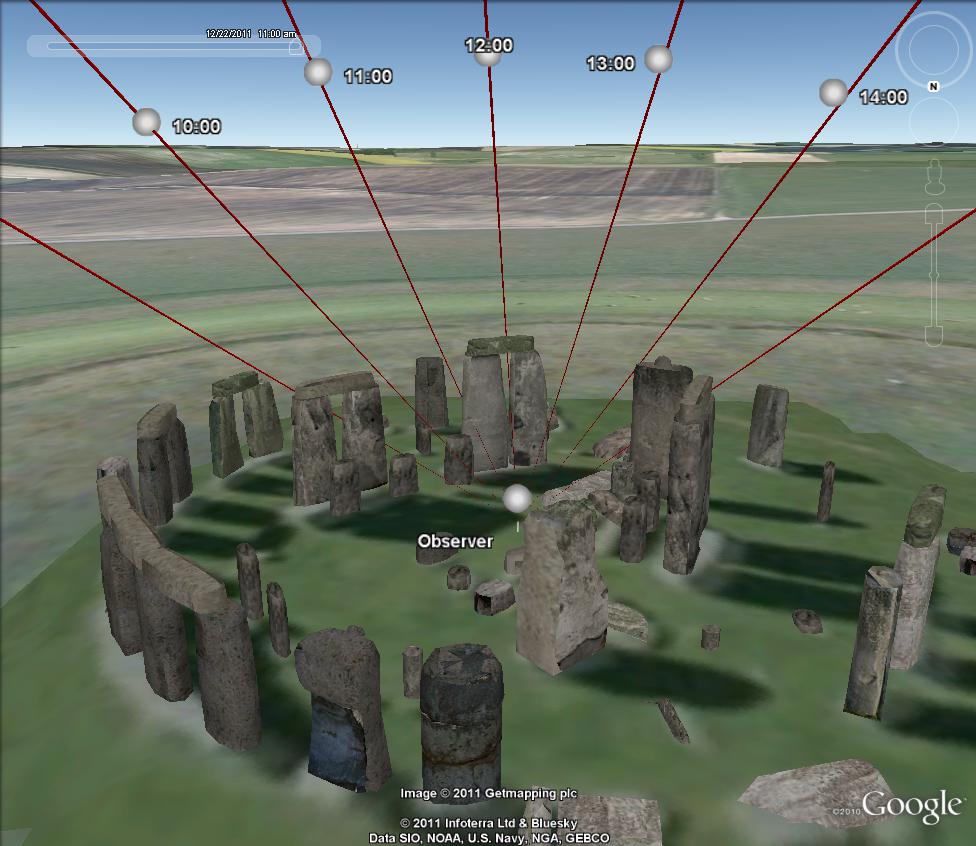
Screenshot showing ephemeris data for an observer at Stonehenge.
#!/usr/bin/python
'''Example of using pyKML to visualize ephemeris data

This example demonstrates how pyKML can be used visualize geospatial data
generated by another Python library, PyEphem (http://rhodesmill.org/pyephem/).

Example usage:
python pyephem_example.py > test.kml
'''

from datetime import datetime, timedelta
from math import pi, degrees, radians
from operator import mod
import ephem
from lxml import etree
from pykml.factory import KML_ElementMaker as KML

year = 2011
month = 12
day = 22
longitude = -1.826165 # [degrees]
latitude = 51.178848  # [degrees]
elevation = 101.5     # elevation above sea level [meters]
height = 2            # height of observer [meters]
timezone_offset = 0   # time offset from UTC time [hours]
label_distance = 100  # distance along ephemeris vector [meters]

obs = ephem.Observer()
obs.long, obs.lat = str(longitude), str(latitude)
obs.elev = elevation + height
sun = ephem.Sun()

def adjust_heading_degrees(alpha):
    '''add the heading angle to make it between -180 and 180 degrees'''
    return mod(alpha+180,360)-180

def normalize_vector(x,y,z):
    '''return a unit normal vector'''
    length = (x**2+y**2+z**2)**0.5
    return x/length, y/length, z/length

def calculate_geographic_offset(azimuth_angle,altitude_angle, distance):
    '''determine the displacement in terms of latitude, longitude, and altitude'''
    from math import sin, cos, tan, atan2

    R = 6371009  # radius of earth in meters
    dx,dy,dz = normalize_vector(
        sin(azimuth_angle),
        cos(azimuth_angle),
        tan(altitude_angle),
    )
    alpha = atan2(dy,dx)   # horizontal angle [radians]
    D_horiz = distance*(dx**2+dy**2)**0.5  # horizontal length [meters]
    delta_lat_rad = D_horiz*sin(alpha)/R  # latitude offset [radians]
    delta_lon_rad = D_horiz*cos(alpha)/(R*cos(radians(latitude))) # longitude offset [radians]
    delta_alt = distance*dz  # altitude offset [meters]
    return delta_lat_rad, delta_lon_rad, delta_alt

# iterate through 24 hours, adding ephemeris data to a list
data = []
for hour in range(0,24):
    date = datetime(year,month,day)+timedelta(hours=hour)
    obs.date = '{year}/{month}/{day} {hour}:{minute}'.format(
        year = date.year,
        month = date.month,
        day = date.day,
        hour = date.hour,
        minute = date.minute,
    )
    sun.compute(obs)
    data.append({
        'datetime UTC': date,
        'azimuth_angle': sun.az.real,
        'altitude_angle': sun.alt.real,
    })


# create a KML file skeleton
stylename = "sn_shaded_dot"
doc = KML.kml(
    KML.Document(
        KML.Name("Sun Position"),
        KML.Style(
            KML.IconStyle(
                KML.scale(1.2),
                KML.Icon(
                    KML.href("http://maps.google.com/mapfiles/kml/shapes/shaded_dot.png")
                ),
            ),
            id=stylename,
        )
    )
)

# create placemark for the observer, and add it to the KML document
pm_observer = KML.Placemark(
    KML.name('Observer'),
    KML.styleUrl('#{0}'.format(stylename)),
    KML.Point(
        KML.extrude(True),
        KML.altitudeMode('relativeToGround'),
        KML.coordinates("{0},{1},{2}".format(longitude,latitude,height)),
    ),
)
doc.Document.append(pm_observer)

# iterate through the ephemeris data
for i in data:
    timestamp = i['datetime UTC']
    azimuth_rad = i['azimuth_angle']
    azimuth_deg = degrees(azimuth_rad)
    altitude_rad = i['altitude_angle']
    altitude_deg = degrees(altitude_rad)
    if altitude_deg > 0:
        # define a placemark along the ephemeris vector for labeling
        delta_lat_rad, delta_lon_rad, delta_alt = calculate_geographic_offset(
            azimuth_angle=radians(adjust_heading_degrees(degrees(azimuth_rad))),
            altitude_angle=altitude_rad,
            distance=label_distance,
        )
        pm1 = KML.Placemark(
            KML.name((timestamp+timedelta(timezone_offset)).strftime('%H:%M')),
            KML.styleUrl('#{0}'.format(stylename)),
            KML.LookAt(
                KML.longitude(longitude),
                KML.latitude(latitude),
                KML.altitude(height),
                KML.heading(adjust_heading_degrees(azimuth_deg)),
                KML.tilt(90),
                KML.roll(0),
                KML.altitudeMode("relativeToGround"),
                KML.range(50),
            ),
            KML.Point(
                KML.altitudeMode("relativeToGround"),
                KML.coordinates("{lon},{lat},{alt}".format(
                    lon = longitude + degrees(delta_lon_rad),
                    lat = latitude + degrees(delta_lat_rad),
                    alt = height + delta_alt,
                )),
            ),
        )
        pm2 = KML.Placemark(
            KML.name('Sun View'),
            KML.LookAt(
                KML.longitude(longitude),
                KML.latitude(latitude),
                KML.altitude(height),
                KML.heading(adjust_heading_degrees(180+azimuth_deg)),
                KML.tilt(90-altitude_deg-0.2),
                KML.roll(0),
                KML.altitudeMode("relativeToGround"),
                KML.range(2*label_distance),
            ),
            KML.Model(
                KML.altitudeMode('relativeToGround'),
                KML.Location(
                    KML.longitude(longitude),
                    KML.latitude(latitude),
                    KML.altitude(height),
                ),
                KML.Orientation(
                    KML.heading(adjust_heading_degrees(azimuth_deg)),
                    KML.tilt(90-altitude_deg),
                    KML.roll(0),
                ),
                KML.Scale(
                    KML.x(1000),
                    KML.y(1000),
                    KML.z(500000),
                ),
                KML.Link(
                    KML.href('unit_cone_red.dae'),
                ),
            ),
        )
        doc.Document.append(
            KML.Folder(
                KML.name(timestamp.strftime('%Y-%m-%dT%H:%MZ')),
                pm1,
                pm2,
                KML.TimeStamp(
                    KML.when((timestamp).strftime('%Y-%m-%dT%H:%MZ')),
                ),
            )
        )

print etree.tostring(doc, pretty_print=True)