pyDNase Analysis Scripts
pyDNase installs several scripts which also serve as examples of how to use the pyDNAse API. After you have installed pyDNase these will all be installed into your $PATH, so you can run these directly from your terminal by typing in the name of the script (including the .py extension)
Please have a rummage through the source - it’s all documented (and hopefully understandable!)
example_footprint_scores.py
This script tests that everything has been installed and will run correctly. Upon running it, you should see the following window
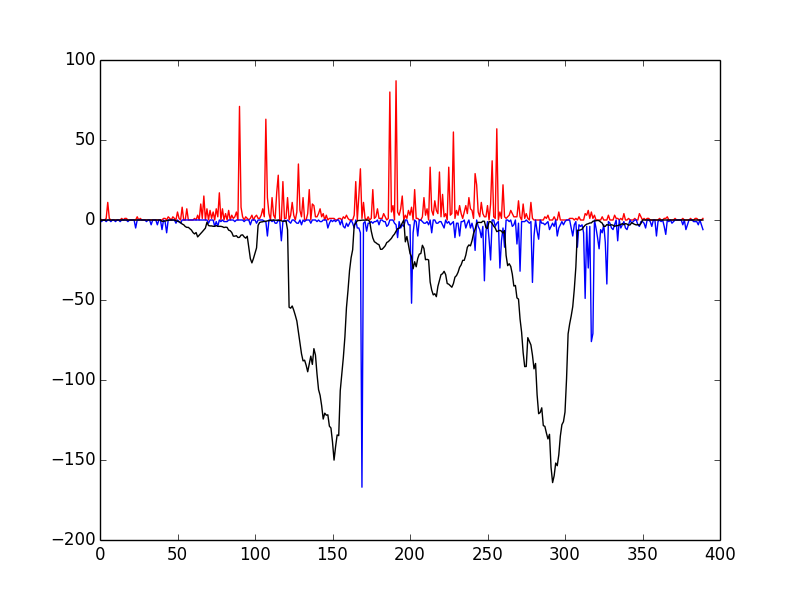
If so, congratulations! Everything has installed properly. The red and blue bars correspond to cuts on the positive and negative strand, respectively, and the black line represents the raw Wellington footprint scores.
dnase_cut_counter.py
This is a very simple script that take a BED and a BAM file and produce a new BED file where the score is the number of DNase cuts found in this region.
usage: dnase_cut_counter.py [-h] [-A] regions reads output

Annotates a BED file with with the number of DNase cuts in it

positional arguments:
  regions     BED file
  reads       The BAM file containing the DNase-seq data
  output      filename to write the output to

optional arguments:
  -h, --help  show this help message and exit
  -A          ATAC-seq mode (default: False)
dnase_average_profile.py
Important
Make sure you look at the next section (DNase I cleavage bias correction)
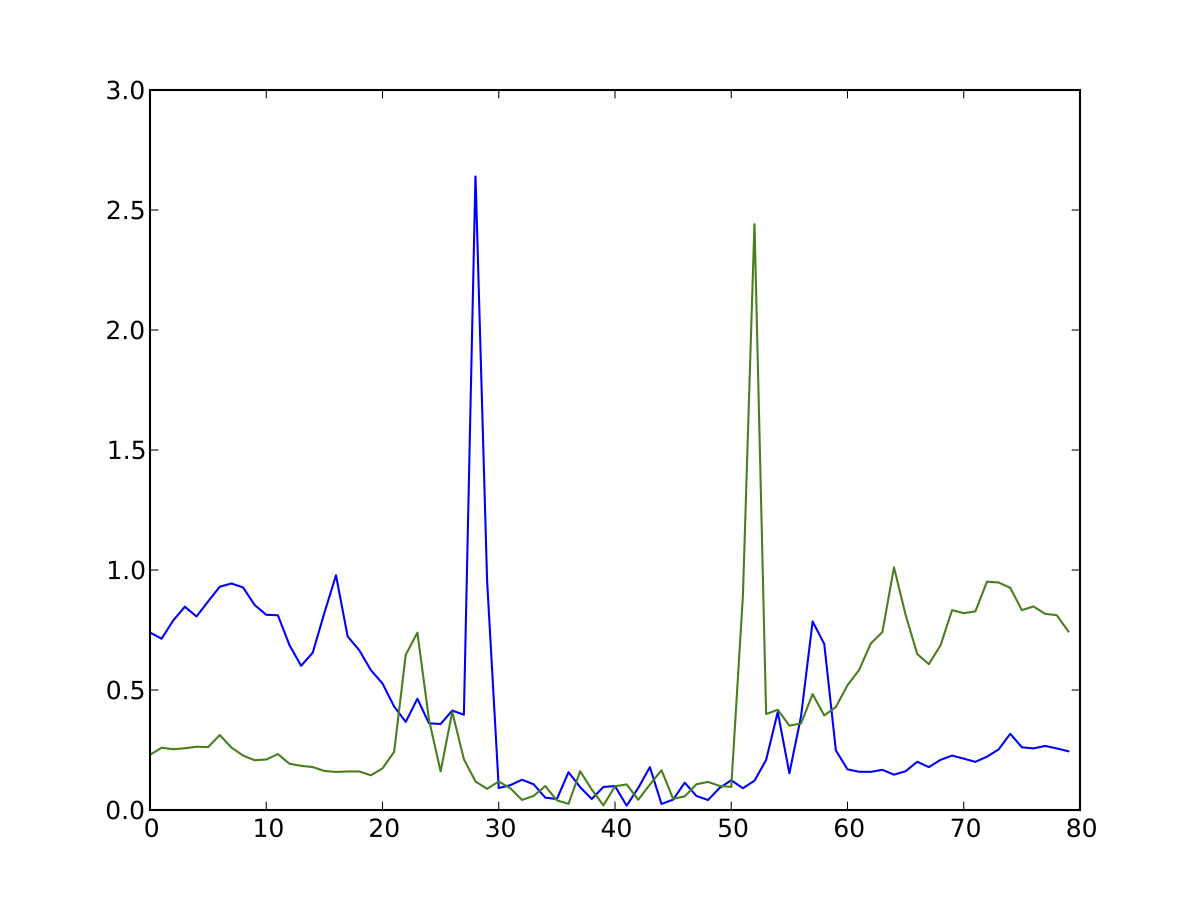
Average profile of DNase I activity surrounding ChIP-seq confirmed CTCF sites in K562 data.
Average profile plots illustrating DNase activity surrounding a set of regions are frequently used in papers. Here, we provide a simple way to generate one.
usage: dnase_average_profile.py [-h] [-w WINDOW_SIZE] [-bf BIAS_FILE] [-i]
                                [-c] [-n] [-b] [-A]
                                regions reads output

Plots average profile of DNase (or Tn5 for ATAC-seq) activity surrounding a
list of regions in a BED file

positional arguments:
  regions               BED file of the regions you want to generate the
                        average profile for
  reads                 The BAM file containing the DNase-seq data
  output                filename to write the output to

optional arguments:
  -h, --help            show this help message and exit
  -w WINDOW_SIZE, --window_size WINDOW_SIZE
                        Size of flanking area around centre of the regions to
                        plot (default: 100)
  -bf BIAS_FILE, --bias-file BIAS_FILE
                        Location of the sorted, index
  -i                    Ignores any strand information in BED file and plots
                        data relative to reference strand
  -c                    Combine the strand information into one graph
  -n                    Normalise cut counts to a fraction peaks
  -b                    Normalise for cutting bias
  -A                    ATAC-seq mode
Hopefully this is self-explanatory. This script uses matplotlib to generate the output,
so it will write a filetype based on the file extension provided (e.g. out.png or output.pdf).
dnase_wig_tracks.py
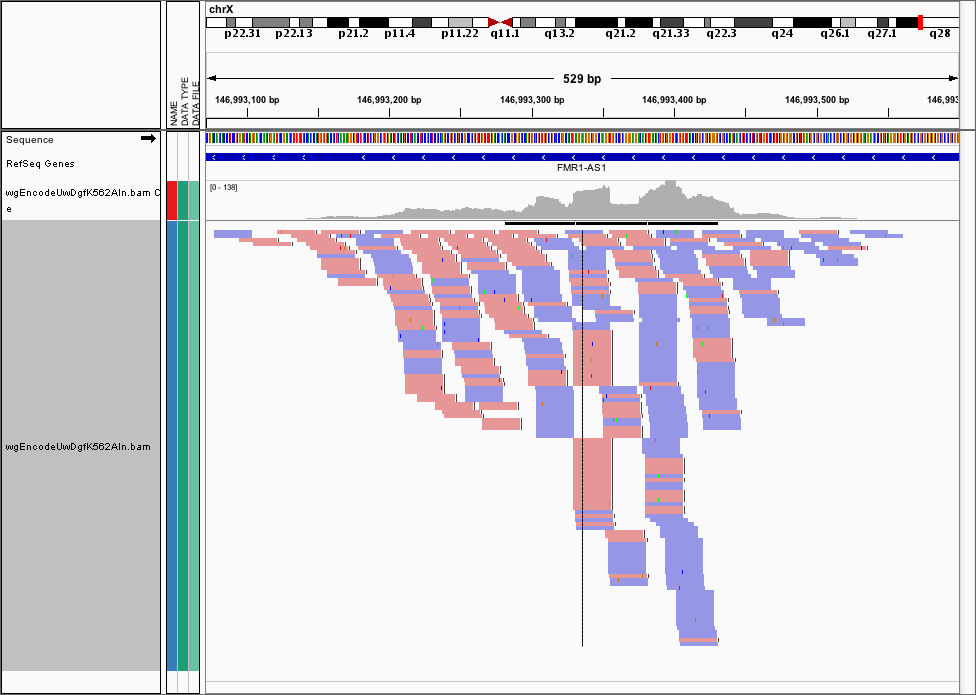
Often, we want to visualise the raw cut data (just the 5’ most ends of the cuts) from a DNase-seq experiment, as visualising the pileups isn’t helpful here. Here’s the FMR1 promoter viewed as a BAM file in IGV
and here’s the corresponding cut locations.
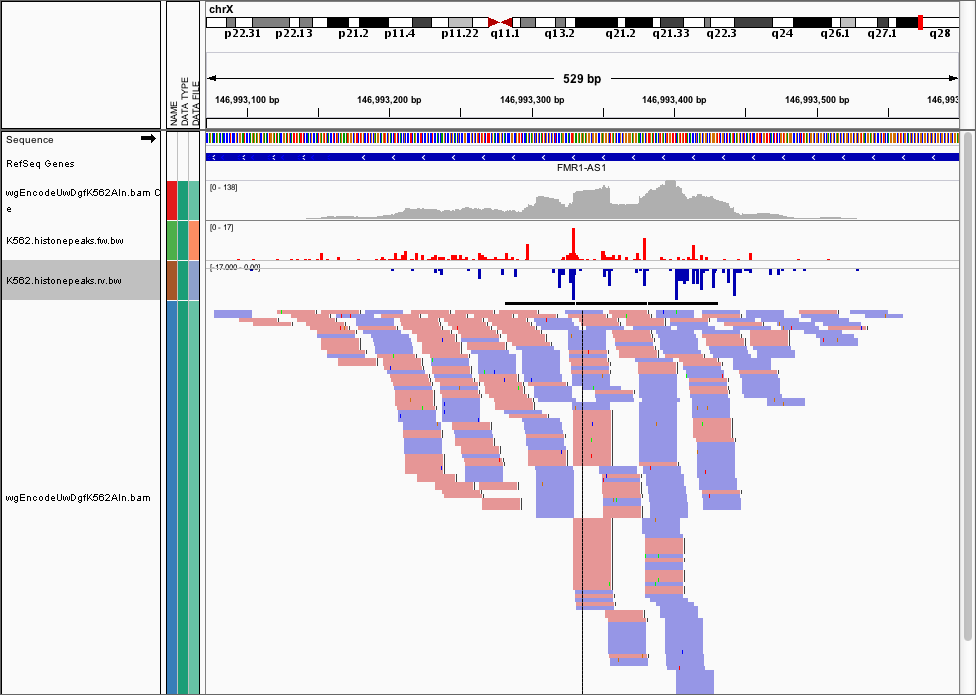
We provide dnase_wig_tracks.py that generates a WIG file (we recommend you convert it to a BigWIG file using UCSC’s wigToBigWig)
based on a BAM file a list of regions of interest
usage: dnase_wig_tracks.py [-h] [-r] [-A] regions reads fw_output rev_output

Writes two WIG files with the cut information based on the regions in reads
BED file and the reads in reads BAM file

positional arguments:
  regions     BED file of the regions you want to write wig tracks for
  reads       The BAM file containing the read data
  fw_output   Path to write the forward reads wig track to
  rev_output  Path to write the reverse reads wig track to

optional arguments:
  -h, --help  show this help message and exit
  -r, --real  Report cuts on the negative strand as positive numbers instead
              of negative (default: False)
  -A          ATAC-seq mode (default: False)
Note that by default, cuts on the reverse strand will be reported as negative numbers (for visualisation). If you want to be using this data for something else, you can pass the -r flag, which will use the real number of cuts.
dnase_to_JSON.py
This outputs DNase-seq data to JSON
usage: dnase_to_JSON.py [-h] [-w WINDOW_SIZE] [-i] [-A] regions reads output

Writes a JSON file of DNase I cuts for regions from a BED file

positional arguments:
  regions               BED file of the regions
  reads                 BAM file containing the read data
  output                filename to write the JSON output to

optional arguments:
  -h, --help            show this help message and exit
  -w WINDOW_SIZE, --window_size WINDOW_SIZE
                        Resize all regions to a specific length
  -i                    Ignores strand information in BED file
  -A                    ATAC-seq mode (default: False)
dnase_to_javatreeview.py
Important
Make sure you look at the next section (DNase I cleavage bias correction)
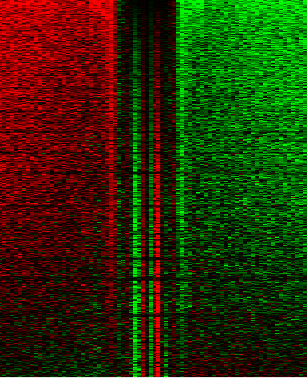
Want to make a heatmap? Love JavaTreeView? So do we! This script will generate a CSV file that you can put straight into JavaTreeView to visualize your data.
The options to be aware of here are -i and -a
usage: dnase_to_javatreeview.py [-h] [-w WINDOW_SIZE] [-i] [-o] [-a] [-n] [-c]
                                [-b] [-A] [-bf BIAS_FILE] [-r]
                                regions reads output

Writes a JavaTreeView file based on the regions in reads BED file and the
reads in reads BAM file

positional arguments:
  regions               BED file of the regions you want to generate the
                        heatmap for
  reads                 The BAM file containing the read data
  output                filename to write the CSV output to

optional arguments:
  -h, --help            show this help message and exit
  -w WINDOW_SIZE, --window_size WINDOW_SIZE
                        Size of flanking area around centre of the regions to
                        plot (default: 100)
  -i                    Ignores strand information in BED file
  -o                    Orders output the same as the input (default: orders
                        by FOS)
  -a                    Write absolute cut counts instead strand imbalanced
                        counts
  -n                    Normalise the cut data for each region between 0 and 1
  -c                    Disable memory caching (low RAM mode)
  -b                    Normalise for cutting bias
  -A                    ATAC-seq mode (default: False)
  -bf BIAS_FILE, --bias-file BIAS_FILE
                        Location of the sorted, index
  -r                    Randomise the ordering of the output
wellington_footprints.py
So you want to get footprints from your data? No problem. We provide a handy script that will do this for you. There’s lots of options here, so please read through them carefully. The most basic usage of the script uses the default parameters described in our original paper. If anything goes wrong at any point, then there should be useful error messages telling you exactly what went wrong.
usage: wellington_footprints.py [-h] [-b] [-sh SHOULDER_SIZES]
                                [-fp FOOTPRINT_SIZES] [-d] [-fdr FDR_CUTOFF]
                                [-fdriter FDR_ITERATIONS]
                                [-fdrlimit FDR_LIMIT] [-pv PV_CUTOFFS] [-dm]
                                [-o OUTPUT_PREFIX] [-p P] [-A]
                                regions reads outputdir

Footprint the DHSs in a DNase-seq or ATAC-seq experiment using the Wellington
Algorithm.

positional arguments:
  regions               BED file of the regions you want to footprint
  reads                 The BAM file containing the DNase-seq reads
  outputdir             A writeable directory to write the results to

optional arguments:
  -h, --help            show this help message and exit
  -b, --bonferroni      Performs a bonferroni correction (default: False)
  -sh SHOULDER_SIZES, --shoulder-sizes SHOULDER_SIZES
                        Range of shoulder sizes to try in format
                        "from,to,step" (default: 35,36,1)
  -fp FOOTPRINT_SIZES, --footprint-sizes FOOTPRINT_SIZES
                        Range of footprint sizes to try in format
                        "from,to,step" (default: 11,26,2)
  -d, --one_dimension   Use Wellington 1D instead of Wellington (default:
                        False)
  -fdr FDR_CUTOFF, --FDR_cutoff FDR_CUTOFF
                        Write footprints using the FDR selection method at a
                        specific FDR (default: 0.01)
  -fdriter FDR_ITERATIONS, --FDR_iterations FDR_ITERATIONS
                        How many randomisations to use when performing FDR
                        calculations (default: 100)
  -fdrlimit FDR_LIMIT, --FDR_limit FDR_LIMIT
                        Minimum p-value to be considered significant for FDR
                        calculation (default: -20)
  -pv PV_CUTOFFS, --pv_cutoffs PV_CUTOFFS
                        Select footprints using a range of pvalue cutoffs
                        (default: -10,-20,-30,-40,-50,-75,-100,-300,-500,-700
  -dm, --dont-merge-footprints
                        Disables merging of overlapping footprints (Default:
                        False)
  -o OUTPUT_PREFIX, --output_prefix OUTPUT_PREFIX
                        The prefix for results files (default:
                        <reads.regions>)
  -p P                  Number of processes to use (default: uses all CPUs)
  -A                    ATAC-seq mode (default: False)
wellington_bootstrap.py
This script will calculate the differential footprints between two DNase-seq datasets using the Wellington-bootstrap algorithm.
usage: wellington_bootstrap.py [-h] [-fp FOOTPRINT_SIZES] [-fdr FDR_CUTOFF]
                               [-fdriter FDR_ITERATIONS] [-fdrlimit FDR_LIMIT]
                               [-p PROCESSES] [-A]
                               treatment_bam control_bam bedsites
                               treatment_only_output control_only_output

Scores Differential Footprints using Wellington-Bootstrap.

positional arguments:
  treatment_bam         BAM file for treatment
  control_bam           BAM file for control
  bedsites              BED file of genomic locations to search in
  treatment_only_output
                        File to write treatment specific fooprints scores to
  control_only_output   File to write control specific footprint scores to

optional arguments:
  -h, --help            show this help message and exit
  -fp FOOTPRINT_SIZES, --footprint-sizes FOOTPRINT_SIZES
                        Range of footprint sizes to try in format
                        "from,to,step" (default: 11,26,2)
  -fdr FDR_CUTOFF, --FDR_cutoff FDR_CUTOFF
                        Detect footprints using the FDR selection method at a
                        specific FDR (default: 0.01)
  -fdriter FDR_ITERATIONS, --FDR_iterations FDR_ITERATIONS
                        How many randomisations to use when performing FDR
                        calculations (default: 100)
  -fdrlimit FDR_LIMIT, --FDR_limit FDR_LIMIT
                        Minimum p-value to be considered significant for FDR
                        calculation (default: -20)
  -p PROCESSES, --processes PROCESSES
                        Number of processes to use (default: uses all CPUs)
  -A                    ATAC-seq mode (default: False)
dnase_ddhs_scorer.py
This will score DHSs between two DNase-seq datasets according to the ∆DHS algorithm (He et al. 2012)
usage: dnase_ddhs_scorer.py [-h] [-l] [-A]
                            regions treat_dhs control_dhs reads_treat
                            reads_control output

Annotates a set of DHSs with the dDHS score (He et al. 2012)

positional arguments:
  regions        The set of BED files you wish to annotate with dDHS scores
  treat_dhs      The DHSs belonging to the Treatment
  control_dhs    The DHSs belonging to the control
  reads_treat    The BAM file containing the Treatment DNase-seq data
  reads_control  The BAM file containing the Control DNase-seq data
  output         filename to write the output to

optional arguments:
  -h, --help     show this help message and exit
  -l             low RAM mode (disables caching) (Default: False)
  -A             ATAC-seq mode (default: False)
dnase_bias_estimator.py
This is mainly here for curiosity reasons - the chances are that if you’re trying to calculate this then you’ll know how to do it.
usage: dnase_bias_estimator.py [-h]
                               regions reads genome_sequence genomesize output

Calculates the 6-mer 5' insertion bias for a NGS dataset

positional arguments:
  regions          BED file of the regions you want to exclude from
                   calculating the bias. This is usually the DHSs.
  reads            The sorted, indexed BAM file containing the DNase-seq data
  genome_sequence  The sorted, indexed FASTA file containing the genome
                   sequence
  genomesize       The .chrom.sizes file containing chromosome sizes generated
                   using something like "mysql --user=genome --host=genome-
                   mysql.cse.ucsc.edu -A -e "select chrom, size from
                   hg19.chromInfo" > hg19.chrom.sizes"
  output           output file prefix to write the observed/expected ratios to
                   (will append .txt and .pickle)

optional arguments:
  -h, --help       show this help message and exit