Examples
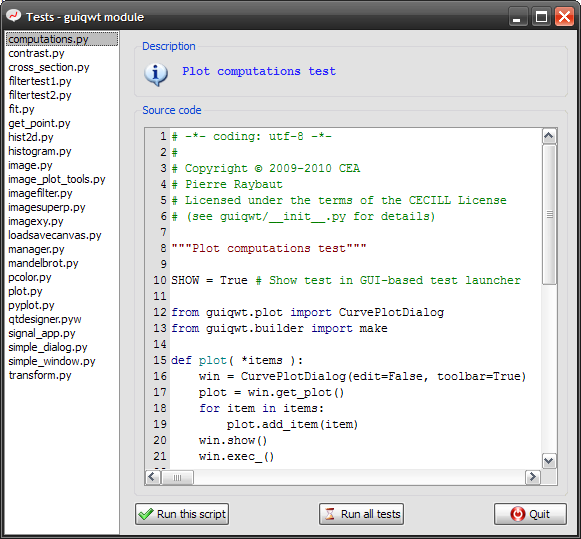
The test launcher
A lot of examples are available in the plotpy test module
from plotpy import tests
tests.run()
The two lines above execute the plotpy test launcher:
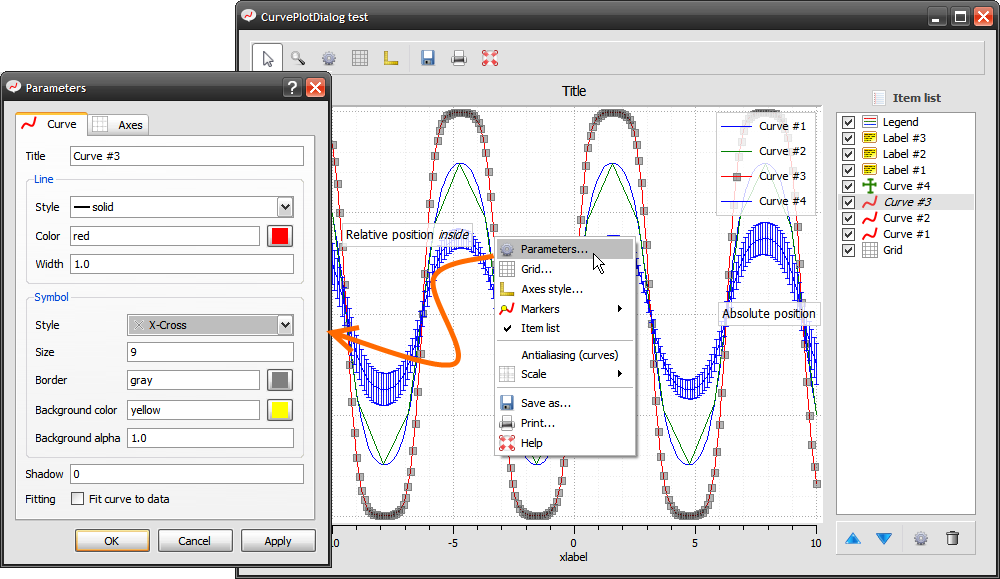
Curve plotting
Basic curve plotting
from guidata.qt.QtGui import QFont

from plotpy.plot import CurveDialog
from plotpy.builder import make

def plot(*items):
    win = CurveDialog(edit=False, toolbar=True, wintitle="CurveDialog test",
                      options=dict(title="Title", xlabel="xlabel",
                                   ylabel="ylabel"))
    plot = win.get_plot()
    for item in items:
        plot.add_item(item)
    plot.set_axis_font("left", QFont("Courier"))
    win.get_itemlist_panel().show()
    plot.set_items_readonly(False)
    win.show()
    win.exec_()

def test():
    """Test"""
    # -- Create QApplication
    import guidata
    _app = guidata.qapplication()
    # --
    from numpy import linspace, sin
    x = linspace(-10, 10, 200)
    dy = x/100.
    y = sin(sin(sin(x)))
    x2 = linspace(-10, 10, 20)
    y2 = sin(sin(sin(x2)))
    curve2 = make.curve(x2, y2, color="g", curvestyle="Sticks")
    curve2.setTitle("toto")
    plot(make.curve(x, y, color="b"),
         curve2,
         make.curve(x, sin(2*y), color="r"),
         make.merror(x, y/2, dy),
         make.label("Relative position <b>outside</b>",
                    (x[0], y[0]), (-10, -10), "BR"),
         make.label("Relative position <i>inside</i>",
                    (x[0], y[0]), (10, 10), "TL"),
         make.label("Absolute position", "R", (0, 0), "R"),
         make.legend("TR"),
         make.marker(position=(5., .8), label_cb=lambda x, y: "A = %.2f" % x,
                     markerstyle="|", movable=False)
         )

if __name__ == "__main__":
    test()
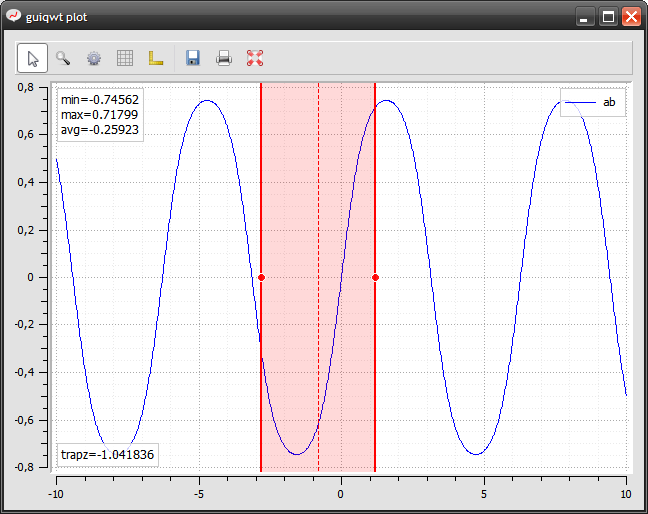
Computations on curves
from plotpy.plot import CurveDialog
from plotpy.builder import make

def plot( *items ):
    win = CurveDialog(edit=False, toolbar=True)
    plot = win.get_plot()
    for item in items:
        plot.add_item(item)
    win.show()
    win.exec_()


def test():
    """Test"""
    # -- Create QApplication
    import guidata
    _app = guidata.qapplication()
    # --
    from numpy import linspace, sin, trapz
    x = linspace(-10, 10, 1000)
    y = sin(sin(sin(x)))

    curve = make.curve(x, y, "ab", "b")
    range = make.range(-2, 2)
    disp0 = make.range_info_label(range, 'BR', "x = %.1f ± %.1f cm",
                                  title="Range infos")

    disp1 = make.computation(range, "BL", "trapz=%g",
                             curve, lambda x, y: trapz(y, x))

    disp2 = make.computations(range, "TL",
                              [(curve, "min=%.5f", lambda x, y: y.min()),
                               (curve, "max=%.5f", lambda x, y: y.max()),
                               (curve, "avg=%.5f", lambda x, y: y.mean())])
    legend = make.legend("TR")
    plot( curve, range, disp0, disp1, disp2, legend)

if __name__ == "__main__":
    test()
Curve fitting
import numpy as np

from plotpy.widgets.fit import FitParam, guifit

def test():
    x = np.linspace(-10, 10, 1000)
    y = np.cos(1.5*x)+np.random.rand(x.shape[0])*.2

    def fit(x, params):
        a, b = params
        return np.cos(b*x)+a

    a = FitParam("Offset", 1., 0., 2.)
    b = FitParam("Frequency", 2., 1., 10., logscale=True)
    params = [a, b]
    values = guifit(x, y, fit, params, xlabel="Time (s)", ylabel="Power (a.u.)")

    print(values)
    print([param.value for param in params])

if __name__ == "__main__":
    test()
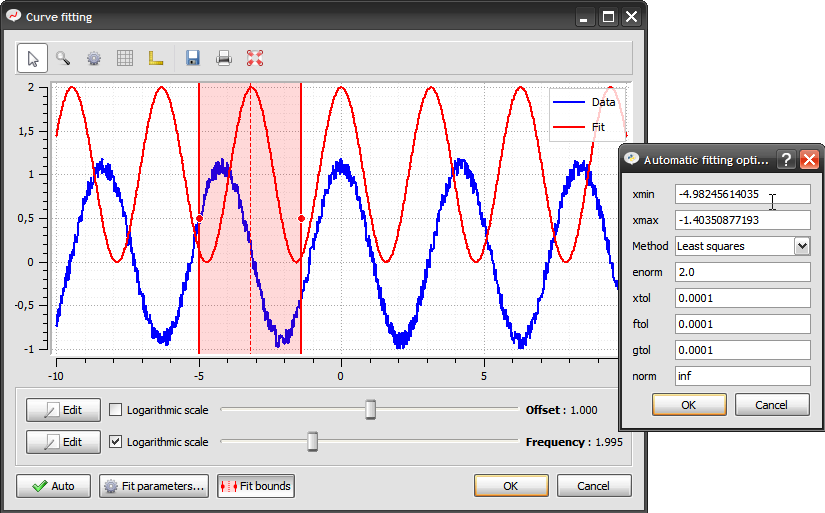
Image visualization
Image contrast adjustment
import os.path as osp

from plotpy.plot import ImageDialog
from plotpy.builder import make

def test():
    """Test"""
    # -- Create QApplication
    import guidata
    _app = guidata.qapplication()
    # --
    filename = osp.join(osp.dirname(__file__), "brain.png")
    image = make.image(filename=filename, title="Original", colormap='gray')

    win = ImageDialog(edit=False, toolbar=True, wintitle="Contrast test",
                      options=dict(show_contrast=True))
    plot = win.get_plot()
    plot.add_item(image)
    win.resize(600, 600)
    win.show()
    try:
        plot.save_widget('contrast.png')
    except IOError:
        # Skipping this part of the test
        # because user has no write permission on current directory
        pass
    win.exec_()

if __name__ == "__main__":
    test()
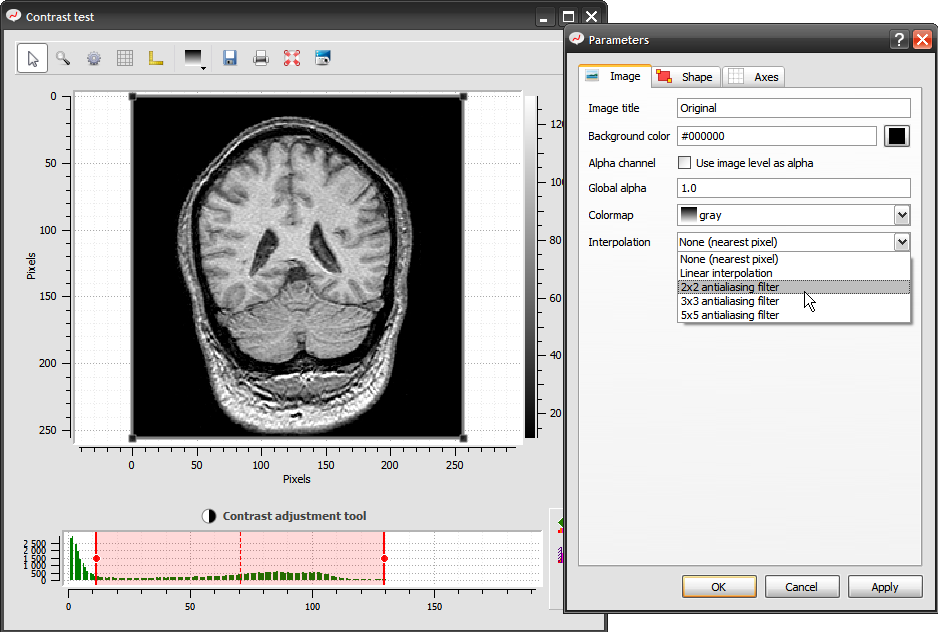
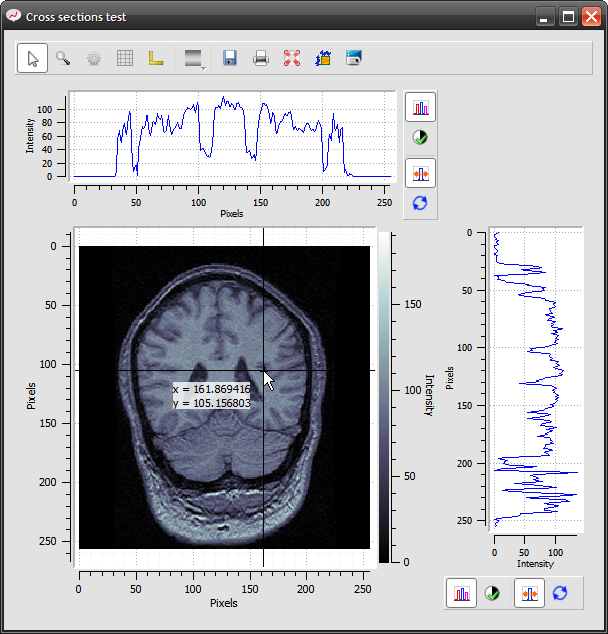
Image cross-sections
import os.path as osp, numpy as np

from plotpy.plot import ImageDialog
from plotpy.builder import make

def create_window():
    win = ImageDialog(edit=False, toolbar=True, wintitle="Cross sections test",
                      options=dict(show_xsection=True, show_ysection=True,
                                   show_itemlist=True))
    win.resize(800, 600)
    return win

def test():
    """Test"""
    # -- Create QApplication
    import guidata
    _app = guidata.qapplication()
    # --
    filename = osp.join(osp.dirname(__file__), "brain.png")
    win = create_window()
    image = make.image(filename=filename, colormap="bone")
    data2 = np.array(image.data.T[200:], copy=True)
    image2 = make.image(data2, title="Modified", alpha_mask=True)
    plot = win.get_plot()
    plot.add_item(image)
    plot.add_item(image2, z=1)
    win.exec_()

if __name__ == "__main__":
    test()
Transformable images
Affine transforms example on 3000x3000 images (real-time transforms):
from guidata.qt.QtCore import QRectF
from guidata.qt.QtGui import QImage

import os
import numpy as np

from plotpy.image import assemble_imageitems
from plotpy.plot import ImageDialog
from plotpy.builder import make
from plotpy import io

DEFAULT_CHARS = "".join([chr(c) for c in range(32, 256)])

def get_font_array(sz, chars=DEFAULT_CHARS):
    from guidata.qt.QtGui import QFont, QPainter, QColor
    font = QFont()
    font.setFixedPitch(True)
    font.setPixelSize(sz)
    font.setStyleStrategy(QFont.NoAntialias)
    dummy = QImage(10, 10, QImage.Format_ARGB32)
    pnt = QPainter(dummy)
    pnt.setFont(font)
    metric = pnt.fontMetrics()
    rct = metric.boundingRect(chars)
    pnt.end()
    h = rct.height()
    w = rct.width()
    img = QImage(w, h, QImage.Format_ARGB32)
    paint = QPainter()
    paint.begin(img)
    paint.setFont(font)
    paint.setBrush( QColor(255, 255, 255) )
    paint.setPen( QColor(255, 255, 255) )
    paint.drawRect(0, 0, w+1, h+1)
    paint.setPen( QColor(0, 0, 0))
    paint.setBrush( QColor(0, 0, 0) )
    paint.drawText(0, paint.fontMetrics().ascent(), chars)
    paint.end()
    try:
        try:
            data = img.bits().asstring(img.numBytes())
        except AttributeError:
            # PyQt5
            data = img.bits().asstring(img.byteCount())
    except SystemError:
        # Python 3
        return
    npy = np.frombuffer(data, np.uint8)
    npy.shape = img.height(), img.bytesPerLine()/4, 4
    return npy[:,:, 0]

def txtwrite(data, x, y, sz, txt, range=None):
    arr = get_font_array(sz, txt)
    if arr is None:
        return
    if range is None:
        m, M = data.min(), data.max()
    else:
        m, M = range
    z = (float(M)-float(m))*np.array(arr, float)/255.+m
    arr = np.array(z, data.dtype)
    dy, dx = arr.shape
    data[y:y+dy, x:x+dx] = arr


def imshow(items, title=""):
    gridparam = make.gridparam(background="black", minor_enabled=(False, False),
                               major_style=(".", "gray", 1))
    win = ImageDialog(edit=False, toolbar=True, wintitle=title,
                      options=dict(gridparam=gridparam))
    nc = int(np.sqrt(len(items))+1.0)
    maxy = 0
    y = 0
    x = 0
    w = None
    plot = win.get_plot()
    print("-"*80)
    for i, item in enumerate(items):
        h = item.boundingRect().height()
        if i%nc==0:
            x = 0
            y += maxy
            maxy = h
        else:
            x += w
            maxy = max(maxy, h)
        w = item.boundingRect().width()

        item.set_transform(x, y, 0.0)
        print("Adding item #%d..." % i, end=' ')
        plot.add_item(item)
        print("Done")
    win.show()
    win.exec_()

def compute_image(NX, NY):
    BX, BY = 40, 40
    img = np.random.normal(0, 100, size=(BX, BY))
    timg = np.fft.fftshift(np.fft.fft2(img))
    print(timg.shape)
    cx = NX/2
    cy = NY/2
    bx2 = BX/2
    by2 = BY/2
    z=np.zeros( (NX, NY), np.complex64)
    z[cx-bx2:cx-bx2+BX, cy-by2:cy-by2+BY] = timg
    z = np.fft.ifftshift(z)
    rev = np.fft.ifft2(z)
    return np.abs(rev)

def get_bbox(items):
    r = QRectF()
    for it in items:
        r = r.united(it.boundingRect())
    return r

def save_image(name, data):
    for fname in (name+".u16.tif", name+".u8.png"):
        if os.path.exists(fname):
            os.remove(fname)
    print("Saving image: %d x %d (%d KB):" % (data.shape[0], data.shape[1],
                                              data.nbytes/1024.))
    print(" --> uint16")
    io.imwrite(name+".u16.tif", data, dtype=np.uint16, max_range=True)
    print(" --> uint8")
    io.imwrite(name+".u8.png", data, dtype=np.uint8, max_range=True)

def build_image(items):
    r = get_bbox(items)
    x, y, w, h = r.getRect()
    print("-"*80)
    print("Assemble test1:", w, "x", h)
    dest = assemble_imageitems(items, r, w, h)
    save_image("test1", dest)
    print("-"*80)
    print("Assemble test2:", w/4, "x", h/4)
    dest = assemble_imageitems(items, r, w/4, h/4)
    save_image("test2", dest)
    print("-"*80)

def test():
    """Test"""
    N = 500
    data = compute_image(N, N)
    m = data.min()
    M = data.max()
    items = [make.trimage(data, alpha_mask=True, colormap="jet")]
    for type in (np.uint8, np.uint16, np.int8, np.int16):
        info = np.iinfo(type().dtype)
        s = float((info.max-info.min))
        a1 = s*(data-m)/(M-m)
        img = np.array(a1+info.min, type)
        txtwrite(img, 0, 0, N/15., str(type))
        items.append(make.trimage(img, colormap="jet"))
    imshow(items, title="Transform test (%dx%d images)" % (N, N))
    return items

if __name__ == "__main__":
    # -- Create QApplication
    import guidata
    _app = guidata.qapplication()
    # --
    items = test()
    build_image(items)
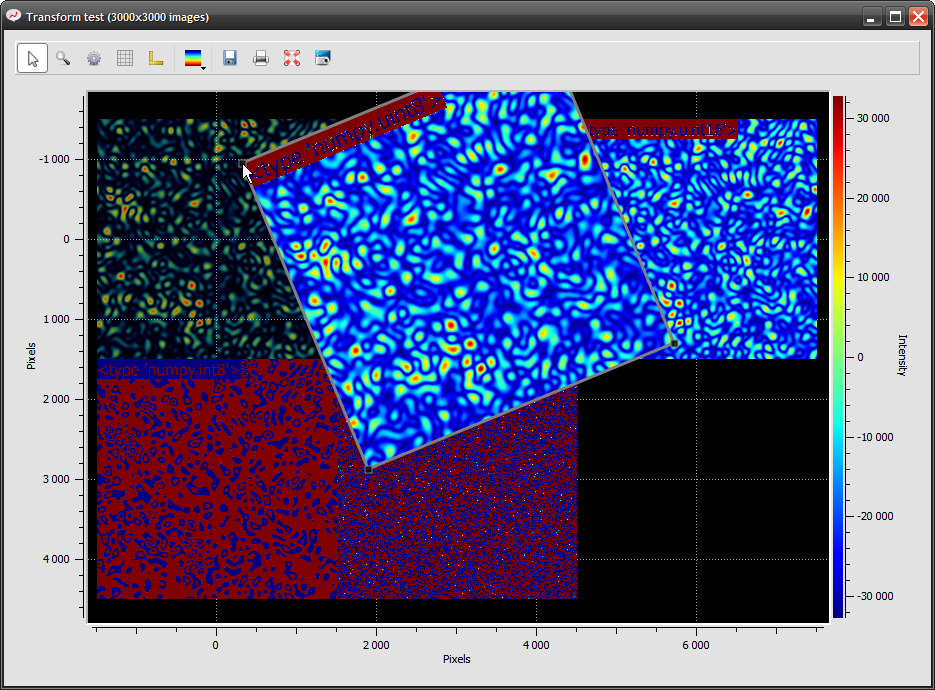
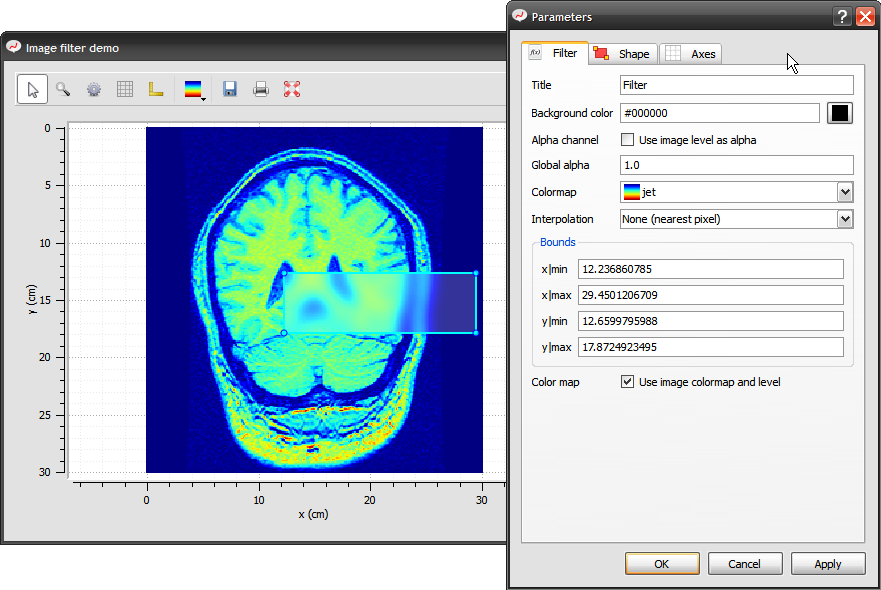
Image rectangular filter
from scipy.ndimage import gaussian_filter

from plotpy.plot import ImageDialog
from plotpy.builder import make

def imshow(x, y, data, filter_area, yreverse=True):
    win = ImageDialog(edit=False, toolbar=True, wintitle="Image filter demo",
                      options=dict(xlabel="x (cm)", ylabel="y (cm)",
                                   yreverse=yreverse))
    image = make.xyimage(x, y, data)
    plot = win.get_plot()
    plot.add_item(image)
    xmin, xmax, ymin, ymax = filter_area
    flt = make.imagefilter(xmin, xmax, ymin, ymax, image,
                           filter=lambda x, y, data: gaussian_filter(data, 5))
    plot.add_item(flt, z=1)
    plot.replot()
    win.show()
    win.exec_()

def test():
    """Test"""
    # -- Create QApplication
    import guidata
    _app = guidata.qapplication()
    # --
    from plotpy.tests.imagexy import compute_image
    x, y, data = compute_image()
    imshow(x, y, data, filter_area=(-3., -1., 0., 2.), yreverse=False)
    # --
    import os.path as osp, numpy as np
    from plotpy import io
    filename = osp.join(osp.dirname(__file__), "brain.png")
    data = io.imread(filename, to_grayscale=True)
    x = np.linspace(0, 30., data.shape[1])
    y = np.linspace(0, 30., data.shape[0])
    imshow(x, y, data, filter_area=(10, 20, 5, 15))

if __name__ == "__main__":
    test()
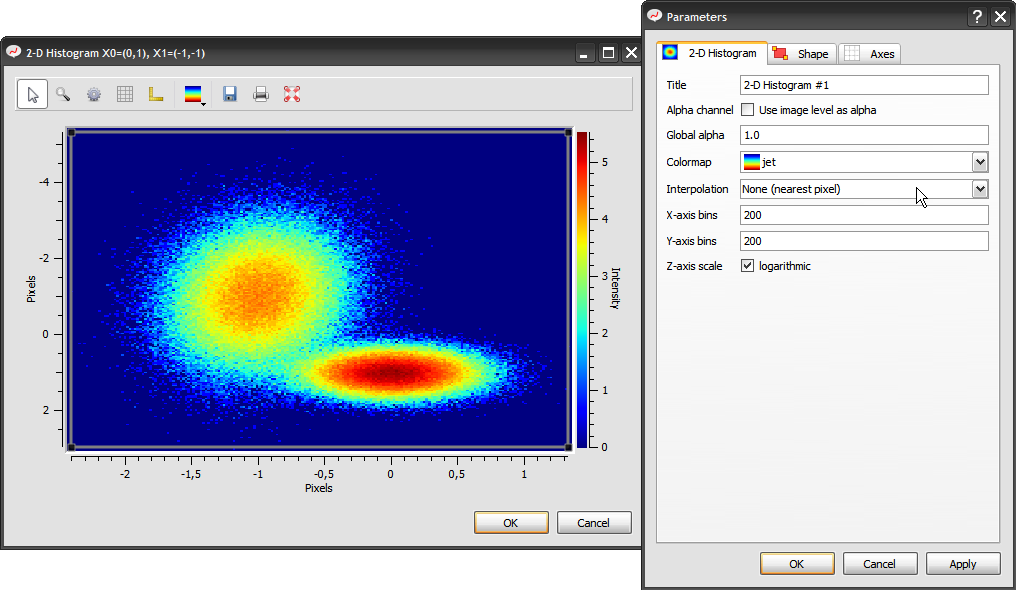
Histograms
2-D histogram
from numpy import random, array, dot, concatenate

from plotpy.plot import ImageDialog
from plotpy.builder import make
from plotpy.config import _

def hist2d(X, Y):
    win = ImageDialog(edit=True, toolbar=True,
                      wintitle="2-D Histogram X0=(0,1), X1=(-1,-1)")
    hist2d = make.histogram2D(X, Y, 200, 200)
    curve = make.curve(X[::50], Y[::50],
                       linestyle='', marker='+', title=_("Markers"))
    plot = win.get_plot()
    plot.set_aspect_ratio(lock=False)
    plot.set_antialiasing(False)
    plot.add_item(hist2d)
    plot.add_item(curve)
    plot.set_item_visible(curve, False)
    win.show()
    win.exec_()

if __name__ == "__main__":
    import guidata
    _app = guidata.qapplication()
    N = 150000
    m = array([[ 1., .2], [-.2, 3.]])
    X1 = random.normal(0, .3, size=(N, 2))
    X2 = random.normal(0, .3, size=(N, 2))
    X = concatenate((X1+[0, 1.], dot(X2, m)+[-1, -1.]))
    hist2d(X[:, 0], X[:, 1])
Other examples
Dot Array Demo
import numpy as np

import guidata.qt.QtCore as QtCore
import guidata.qt.QtGui as QtGui

import guidata.dataset.datatypes as gdt
import guidata.dataset.dataitems as gdi
import guidata.dataset.qtwidgets as gdq
import guidata.configtools as configtools

import plotpy.plot as gqp
import plotpy.curve as gqc
import plotpy.image as gqi
import plotpy.tools as gqt


class DotArrayParam(gdt.DataSet):
    """Dot array"""
    g1 = gdt.BeginGroup("Size of the area")
    dim_h = gdi.FloatItem("Width", default=20, min=0, unit="mm")
    dim_v = gdi.FloatItem("Height", default=20, min=0, unit="mm")
    _g1 = gdt.EndGroup("Size of the area")

    g2 = gdt.BeginGroup("Grid pattern properties")
    step_x = gdi.FloatItem("Step in X-axis", default=1, min=1, unit="mm")
    step_y = gdi.FloatItem("Step in Y-axis", default=1, min=1, unit="mm")
    size = gdi.FloatItem("Dot size", default=.2, min=0, max=2, slider=True, unit="mm")
    color = gdi.ColorItem("Dot color", default="red")
    _g2 = gdt.EndGroup("Grid pattern properties")

    def update_image(self, obj):
        self._update_cb()

    def update_param(self, obj):
        pass


class DotArrayItem(gqi.RawImageItem):
    def __init__(self, imageparam=None):
        super(DotArrayItem, self).__init__(np.zeros((1, 1)), imageparam)
        self.update_border()

    def boundingRect(self):
        param = self.imageparam
        if param is not None:
            return QtCore.QRectF(QtCore.QPointF(-.5*param.size,
                                                -.5*param.size),
                                 QtCore.QPointF(param.dim_h+.5*param.size,
                                                param.dim_v+.5*param.size))

    def types(self):
        return (gqi.IImageItemType,)

    def draw_image(self, painter, canvasRect, srcRect, dstRect, xMap, yMap):
        painter.setRenderHint(QtGui.QPainter.Antialiasing, True)
        param = self.imageparam
        xcoords = gqc.vmap(xMap, np.arange(0, param.dim_h+1, param.step_x))
        ycoords = gqc.vmap(yMap, np.arange(0, param.dim_v+1, param.step_y))
        rx = .5*param.size*xMap.pDist()/xMap.sDist()
        ry = .5*param.size*yMap.pDist()/yMap.sDist()
        color = QtGui.QColor(param.color)
        painter.setPen(QtGui.QPen(color))
        painter.setBrush(QtGui.QBrush(color))
        for xc in xcoords:
            for yc in ycoords:
                painter.drawEllipse(QtCore.QPointF(xc, yc), rx, ry)


class CustomHelpTool(gqt.HelpTool):
    def activate_command(self, plot, checked):
        QtGui.QMessageBox.information(plot, "Help",
                                """**to be customized**
Keyboard/mouse shortcuts:
  - single left-click: item (curve, image, ...) selection
  - single right-click: context-menu relative to selected item
  - shift: on-active-curve (or image) cursor
  - alt: free cursor
  - left-click + mouse move: move item (when available)
  - middle-click + mouse move: pan
  - right-click + mouse move: zoom""")


class DotArrayDialog(gqp.ImageDialog):
    def __init__(self):
        self.item = None
        self.stamp_gbox = None
        super(DotArrayDialog, self).__init__(wintitle="Dot array example",
#            icon="path/to/your_icon.png",
            toolbar=True, edit=True)
        self.resize(900, 600)

    def register_tools(self):
        self.register_standard_tools()
        self.add_separator_tool()
        self.add_tool(gqt.SaveAsTool)
        self.add_tool(gqt.CopyToClipboardTool)
        self.add_tool(gqt.PrintTool)
        self.add_tool(CustomHelpTool)
        self.activate_default_tool()
        plot = self.get_plot()
        plot.enableAxis(plot.yRight, False)
        plot.set_aspect_ratio(lock=True)

    def create_plot(self, options):
        logo_path = configtools.get_image_file_path("plotpy.svg")
        logo = QtGui.QLabel()
        logo.setPixmap(QtGui.QPixmap(logo_path))
        logo.setAlignment(QtCore.Qt.AlignCenter)
        self.plot_layout.addWidget(logo, 1, 1)
        logo_txt = QtGui.QLabel("Powered by <b>plotpy</b>")
        logo_txt.setAlignment(QtCore.Qt.AlignHCenter|QtCore.Qt.AlignTop)
        self.plot_layout.addWidget(logo_txt, 2, 1)
        self.stamp_gbox = gdq.DataSetEditGroupBox("Dots", DotArrayParam)
        try:
            # plotpy v3:
            self.stamp_gbox.SIG_APPLY_BUTTON_CLICKED.connect(self.apply_params)
        except AttributeError:
            # plotpy v2:
            from guidata.qt.QtCore import SIGNAL
            self.connect(self.stamp_gbox, SIGNAL("apply_button_clicked()"),
                         self.apply_params)
        self.plot_layout.addWidget(self.stamp_gbox, 0, 1)
        options = dict(title="Main plot")
        gqp.ImageDialog.create_plot(self, options, 0, 0, 3, 1)

    def show_data(self, param):
        plot = self.get_plot()
        if self.item is None:
            param._update_cb = lambda: self.stamp_gbox.get()
            self.item = DotArrayItem(param)
            plot.add_item(self.item)
        else:
            self.item.update_border()
        plot.do_autoscale()

    def apply_params(self):
        param = self.stamp_gbox.dataset
        self.show_data(param)


if __name__ == "__main__":
    # -- Create QApplication
    import guidata
    _app = guidata.qapplication()

    dlg = DotArrayDialog()
    dlg.apply_params()
    dlg.exec_()
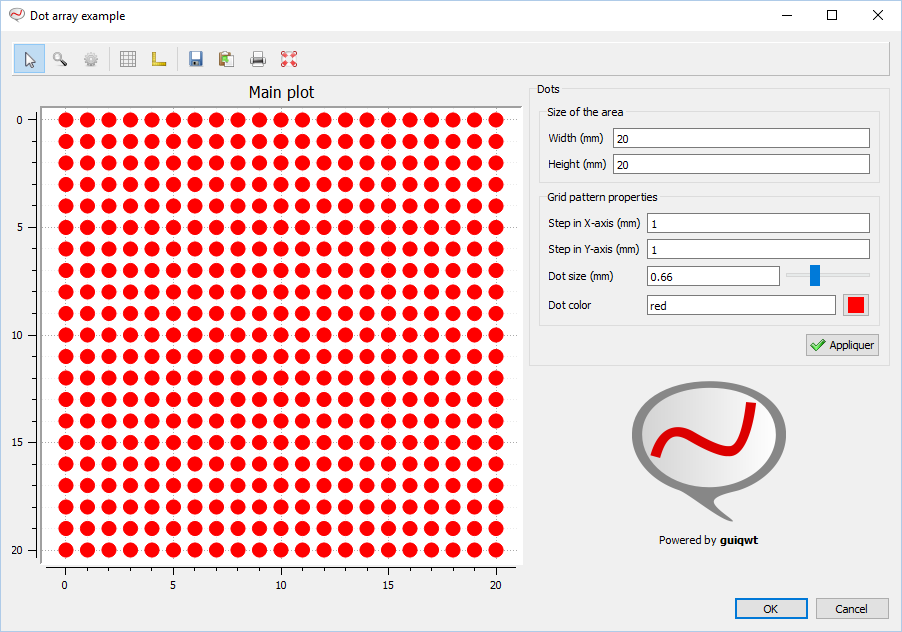
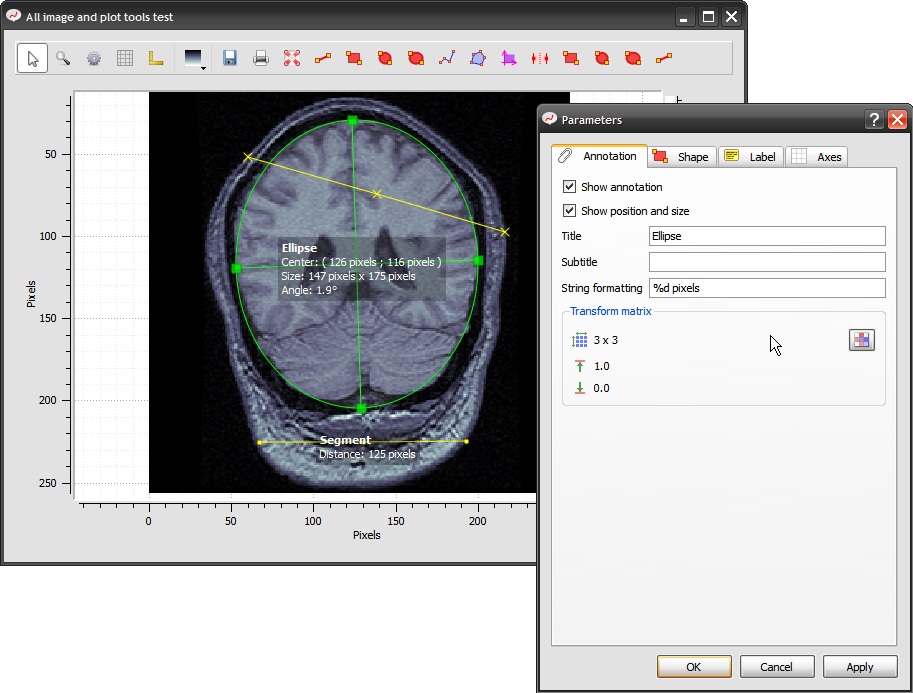
Image plot tools
import os.path as osp

from plotpy.plot import ImageDialog
from plotpy.tools import (RectangleTool, EllipseTool, HRangeTool, PlaceAxesTool,
                          MultiLineTool, FreeFormTool, SegmentTool, CircleTool,
                          AnnotatedRectangleTool, AnnotatedEllipseTool,
                          AnnotatedSegmentTool, AnnotatedCircleTool, LabelTool,
                          AnnotatedPointTool,
                          VCursorTool, HCursorTool, XCursorTool,
                          ObliqueRectangleTool, AnnotatedObliqueRectangleTool)
from plotpy.builder import make

def create_window():
    win = ImageDialog(edit=False, toolbar=True,
                      wintitle="All image and plot tools test")
    for toolklass in (LabelTool, HRangeTool,
                      VCursorTool, HCursorTool, XCursorTool,
                      SegmentTool, RectangleTool, ObliqueRectangleTool,
                      CircleTool, EllipseTool,
                      MultiLineTool, FreeFormTool, PlaceAxesTool,
                      AnnotatedRectangleTool, AnnotatedObliqueRectangleTool,
                      AnnotatedCircleTool, AnnotatedEllipseTool,
                      AnnotatedSegmentTool, AnnotatedPointTool):
        win.add_tool(toolklass)
    return win

def test():
    """Test"""
    # -- Create QApplication
    import guidata
    _app = guidata.qapplication()
    # --
    filename = osp.join(osp.dirname(__file__), "brain.png")
    win = create_window()
    image = make.image(filename=filename, colormap="bone")
    plot = win.get_plot()
    plot.add_item(image)
    win.exec_()

if __name__ == "__main__":
    test()
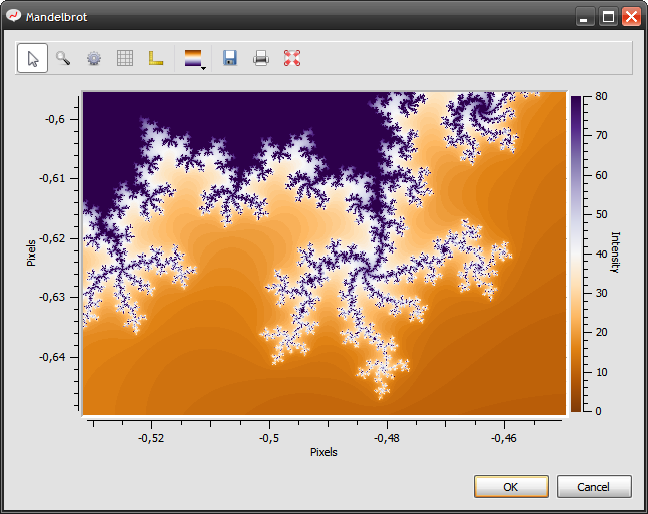
Real-time Mandelbrot plotting
import numpy as np

from guidata.qt.QtCore import QRectF, QPointF

from plotpy.config import _
from plotpy.plot import ImageDialog
from plotpy.image import RawImageItem
from plotpy.tools import ToggleTool
from plotpy.mandelbrot import mandelbrot


class FullScale(ToggleTool):
    def __init__(self, parent, image):
        super(FullScale, self).__init__(parent, _("MAX resolution"), None)
        self.image = image
        self.minprec = image.IMAX
        self.maxprec = 5*image.IMAX

    def activate_command(self, plot, checked):
        if self.image.IMAX == self.minprec:
            self.image.IMAX = self.maxprec
        else:
            self.image.IMAX = self.minprec
        self.image.set_lut_range([0, self.image.IMAX])
        plot.replot()

    def update_status(self, plot):
        self.action.setChecked(self.image.IMAX == self.maxprec)

class MandelItem(RawImageItem):
    def __init__(self, xmin, xmax, ymin, ymax):
        super(MandelItem, self).__init__(np.zeros((1, 1), np.uint8))
        self.bounds = QRectF(QPointF(xmin, ymin),
                             QPointF(xmax, ymax))
        self.update_border()
        self.IMAX = 80
        self.set_lut_range([0, self.IMAX])

    #---- QwtPlotItem API ------------------------------------------------------
    def draw_image(self, painter, canvasRect, srcRect, dstRect, xMap, yMap):
        x1, y1 = canvasRect.left(), canvasRect.top()
        x2, y2 = canvasRect.right(), canvasRect.bottom()
        i1, j1, i2, j2 = srcRect

        NX = x2-x1
        NY = y2-y1
        if self.data.shape != (NX, NY):
            self.data = np.zeros((NY, NX), np.uint8)
        mandelbrot(i1, j1, i2, j2, self.data, self.IMAX)

        srcRect = (0, 0, NX, NY)
        x1, y1, x2, y2 = canvasRect.getCoords()
        RawImageItem.draw_image(self, painter, canvasRect,
                                srcRect, (x1, y1, x2, y2), xMap, yMap)

def mandel():
    win = ImageDialog(edit=True, toolbar=True, wintitle="Mandelbrot",
                      options=dict(yreverse=False))
    mandel = MandelItem(-1.5, .5, -1., 1.)
    win.add_tool(FullScale, mandel)
    plot = win.get_plot()
    plot.set_aspect_ratio(lock=False)
    plot.add_item(mandel)
    plot.set_full_scale(mandel)
    win.show()
    win.exec_()

if __name__ == "__main__":
    import guidata
    _app = guidata.qapplication()
    mandel()
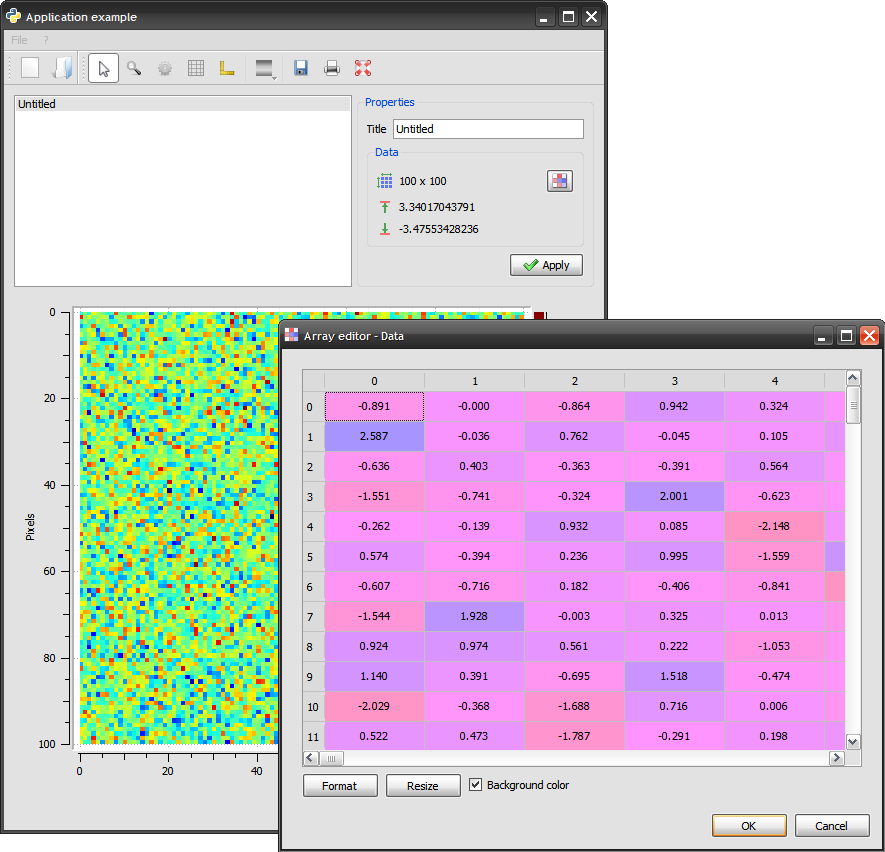
Simple application
from guidata.qt.QtGui import QMainWindow, QMessageBox, QSplitter, QListWidget
from guidata.qt.QtCore import QSize, QT_VERSION_STR, PYQT_VERSION_STR, Qt
from guidata.qt.compat import getopenfilename
import sys, platform
import numpy as np
from guidata.dataset.datatypes import DataSet, GetAttrProp
from guidata.dataset.dataitems import (IntItem, FloatArrayItem, StringItem,
ChoiceItem)
from guidata.dataset.qtwidgets import DataSetEditGroupBox
from guidata.configtools import get_icon
from guidata.qthelpers import create_action, add_actions, get_std_icon
from guidata.utils import update_dataset
from guidata.py3compat import to_text_string
from plotpy.config import _
from plotpy.plot import ImageWidget
from plotpy.builder import make
from plotpy import io
APP_NAME = _("Application example")
VERSION = '1.0.0'
class ImageParam(DataSet):
_hide_data = False
_hide_size = True
title = StringItem(_("Title"), default=_("Untitled"))
data = FloatArrayItem(_("Data")).set_prop("display",
hide=GetAttrProp("_hide_data"))
width = IntItem(_("Width"), help=_("Image width (pixels)"), min=1,
default=100).set_prop("display",
hide=GetAttrProp("_hide_size"))
height = IntItem(_("Height"), help=_("Image height (pixels)"), min=1,
default=100).set_prop("display",
hide=GetAttrProp("_hide_size"))
class ImageParamNew(ImageParam):
_hide_data = True
_hide_size = False
type = ChoiceItem(_("Type"),
(("rand", _("random")), ("zeros", _("zeros"))))
class ImageListWithProperties(QSplitter):
def __init__(self, parent):
QSplitter.__init__(self, parent)
self.imagelist = QListWidget(self)
self.addWidget(self.imagelist)
self.properties = DataSetEditGroupBox(_("Properties"), ImageParam)
self.properties.setEnabled(False)
self.addWidget(self.properties)
class CentralWidget(QSplitter):
def __init__(self, parent, toolbar):
QSplitter.__init__(self, parent)
self.setContentsMargins(10, 10, 10, 10)
self.setOrientation(Qt.Vertical)
imagelistwithproperties = ImageListWithProperties(self)
self.addWidget(imagelistwithproperties)
self.imagelist = imagelistwithproperties.imagelist
self.imagelist.currentRowChanged.connect(self.current_item_changed)
self.imagelist.itemSelectionChanged.connect(self.selection_changed)
self.properties = imagelistwithproperties.properties
self.properties.SIG_APPLY_BUTTON_CLICKED.connect(self.properties_changed)
self.imagewidget = ImageWidget(self)
self.imagewidget.plot.SIG_LUT_CHANGED.connect(self.lut_range_changed)
self.item = None # image item
self.imagewidget.add_toolbar(toolbar, "default")
self.imagewidget.register_all_image_tools()
self.addWidget(self.imagewidget)
self.images = [] # List of ImageParam instances
self.lut_ranges = [] # List of LUT ranges
self.setStretchFactor(0, 0)
self.setStretchFactor(1, 1)
self.setHandleWidth(10)
self.setSizes([1, 2])
def refresh_list(self):
self.imagelist.clear()
self.imagelist.addItems([image.title for image in self.images])
def selection_changed(self):
"""Image list: selection changed"""
row = self.imagelist.currentRow()
self.properties.setDisabled(row == -1)
def current_item_changed(self, row):
"""Image list: current image changed"""
image, lut_range = self.images[row], self.lut_ranges[row]
self.show_data(image.data, lut_range)
update_dataset(self.properties.dataset, image)
self.properties.get()
def lut_range_changed(self):
row = self.imagelist.currentRow()
self.lut_ranges[row] = self.item.get_lut_range()
def show_data(self, data, lut_range=None):
plot = self.imagewidget.plot
if self.item is not None:
self.item.set_data(data)
if lut_range is None:
lut_range = self.item.get_lut_range()
self.imagewidget.set_contrast_range(*lut_range)
self.imagewidget.update_cross_sections()
else:
self.item = make.image(data)
plot.add_item(self.item, z=0)
plot.replot()
def properties_changed(self):
"""The properties 'Apply' button was clicked: updating image"""
row = self.imagelist.currentRow()
image = self.images[row]
update_dataset(image, self.properties.dataset)
self.refresh_list()
self.show_data(image.data)
def add_image(self, image):
self.images.append(image)
self.lut_ranges.append(None)
self.refresh_list()
self.imagelist.setCurrentRow(len(self.images)-1)
plot = self.imagewidget.plot
plot.do_autoscale()
def add_image_from_file(self, filename):
image = ImageParam()
image.title = to_text_string(filename)
image.data = io.imread(filename, to_grayscale=True)
image.height, image.width = image.data.shape
self.add_image(image)
class MainWindow(QMainWindow):
def __init__(self):
QMainWindow.__init__(self)
self.setup()
def setup(self):
"""Setup window parameters"""
self.setWindowIcon(get_icon('python.png'))
self.setWindowTitle(APP_NAME)
self.resize(QSize(600, 800))
# Welcome message in statusbar:
status = self.statusBar()
status.showMessage(_("Welcome to plotpy application example!"), 5000)
# File menu
file_menu = self.menuBar().addMenu(_("File"))
new_action = create_action(self, _("New..."),
shortcut="Ctrl+N",
icon=get_icon('filenew.png'),
tip=_("Create a new image"),
triggered=self.new_image)
open_action = create_action(self, _("Open..."),
shortcut="Ctrl+O",
icon=get_icon('fileopen.png'),
tip=_("Open an image"),
triggered=self.open_image)
quit_action = create_action(self, _("Quit"),
shortcut="Ctrl+Q",
icon=get_std_icon("DialogCloseButton"),
tip=_("Quit application"),
triggered=self.close)
add_actions(file_menu, (new_action, open_action, None, quit_action))
# Help menu
help_menu = self.menuBar().addMenu("?")
about_action = create_action(self, _("About..."),
icon=get_std_icon('MessageBoxInformation'),
triggered=self.about)
add_actions(help_menu, (about_action,))
main_toolbar = self.addToolBar("Main")
add_actions(main_toolbar, (new_action, open_action, ))
# Set central widget:
toolbar = self.addToolBar("Image")
self.mainwidget = CentralWidget(self, toolbar)
self.setCentralWidget(self.mainwidget)
#------?
def about(self):
QMessageBox.about( self, _("About ")+APP_NAME,
"""<b>%s</b> v%s<p>%s Pierre Raybaut
<br>Copyright © 2009-2010 CEA
<p>Python %s, Qt %s, PyQt %s %s %s""" % \
(APP_NAME, VERSION, _("Developped by"), platform.python_version(),
QT_VERSION_STR, PYQT_VERSION_STR, _("on"), platform.system()) )
#------I/O
def new_image(self):
"""Create a new image"""
imagenew = ImageParamNew(title=_("Create a new image"))
if not imagenew.edit(self):
return
image = ImageParam()
image.title = imagenew.title
if imagenew.type == 'zeros':
image.data = np.zeros((imagenew.width, imagenew.height))
elif imagenew.type == 'rand':
image.data = np.random.randn(imagenew.width, imagenew.height)
self.mainwidget.add_image(image)
def open_image(self):
"""Open image file"""
saved_in, saved_out, saved_err = sys.stdin, sys.stdout, sys.stderr
sys.stdout = None
filename, _filter = getopenfilename(self, _("Open"), "",
io.iohandler.get_filters('load'))
sys.stdin, sys.stdout, sys.stderr = saved_in, saved_out, saved_err
if filename:
self.mainwidget.add_image_from_file(filename)
if __name__ == '__main__':
from guidata import qapplication
app = qapplication()
window = MainWindow()
window.show()
app.exec_()