2. fitter module
main module of the fitter package
Section author: Thomas Cokelaer, Aug 2014
-
class
Fitter(data, xmin=None, xmax=None, bins=100, distributions=None, verbose=True, timeout=10)[source]¶ Fit a data sample to known distributions
A naive approach often performed to figure out the undelying distribution that could have generated a data set, it to compare the histogram of the data with a PDF (probability distribution function) of a known distribution (e.g., normal).
Yet, the parameters of the distribution are not known and there are lots of distributions. Therefore, an automatic way to fit many distributions to the data would be useful, which is what is implemented here.
Given a data sample, we use the fit method of SciPy to extract the parameters of that distribution that best fit the data. We repeat this for all available distributions. Finally, we provide a summary so that one can see the quality of the fit for those distributions
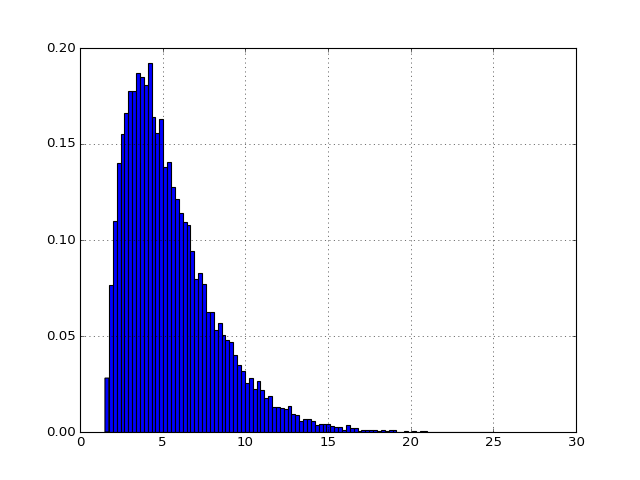
Here is an example where we generate a sample from a gamma distribution.
>>> # First, we create a data sample following a Gamma distribution
>>> from scipy import stats
>>> data = stats.gamma.rvs(2, loc=1.5, scale=2, size=20000)

>>> # We then create the Fitter object
>>> import fitter
>>> f = fitter.Fitter(data)

>>> # just a trick to use only 10 distributions instead of 80 to speed up the fitting
>>> f.distributions = f.distributions[0:10] + ['gamma']

>>> # fit and plot
>>> f.fit()
>>> f.summary()
        sumsquare_error
gamma          0.000095
beta           0.000179
chi            0.012247
cauchy         0.044443
anglit         0.051672
[5 rows x 1 columns]
Once the data has been fitted, the
summary()metod returns a sorted dataframe where theLooping over the 80 distributions in SciPy could takes some times so you can overwrite the
distributionswith a subset if you want. In order to reload all distributions, callload_all_distributions().Some distributions to not converge when fitting. There is a timeout of 10 seconds after which the fitting procedure is cancelled. You can change this
timeoutattribute if needed.If the histogram of the data has outlier of very long tails, you may want to increase the
binsbinning or to ignore data below or above a certain range. This can be achieved by setting thexminandxmaxattributes. If you set xmin, you can come back to the original data by setting xmin to None (same for xmax) or just recreate an instance.Constructor
Parameters: - data (list) – a numpy array or a list
- xmin (float) – if None, use the data minimum value, otherwise histogram and fits will be cut
- xmax (float) – if None, use the data maximum value, otherwise histogram and fits will be cut
- bins (int) – numbers of bins to be used for the cumulative histogram. This has an impact on the quality of the fit.
- distributions (list) – give a list of distributions to look at. IF none, use all scipy distributionsthat have a fit method.
- verbose (bool) –
- timeout – max time for a given distribution. If timeout is reached, the distribution is skipped.
-
distributions= None¶ list of distributions to test
-
fit()[source]¶ Loop over distributions and find best parameter to fit the data for each
When a distribution is fitted onto the data, we populate a set of dataframes:
df_errors:sum of the square errors between the data and the fitted distribution i.e.,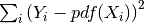
fitted_param: the parameters that best fit the datafitted_pdf: the PDF generated with the parameters that best fit the data
Indices of the dataframes contains the name of the distribution.
-
get_best()[source]¶ Return best fitted distribution and its parameters
a dictionary with one key (the distribution name) and its parameters
-
load_all_distributions()[source]¶ Replace the
distributionsattribute with all scipy distributions
-
plot_pdf(names=None, Nbest=5, lw=2)[source]¶ Plots Probability density functions of the distributions
Parameters: names (str,list) – names can be a single distribution name, or a list of distribution names, or kept as None, in which case, the first Nbest distribution will be taken (default to best 5)
-
xmax¶ consider only data below xmax. reset if None
-
xmin¶ consider only data above xmin. reset if None