7. Tutorials & Examples
This chapter contains a few information and examples to get familiarized with FATSLiM.
7.1. Introduction
7.1.1. Test systems
The following MD systems are used both in the tutorials and as tests to check FATSLiM accuracy (see thickness and area per lipid chapters)
7.1.1.1. Lipid-only system
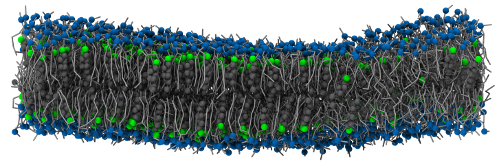
This system is originally from Lukat et al., in which it is called system M2. It consists of a coarse-grained (Martini force field) planar bilayer made of 828 DPPC, 540 DLPC and 576 cholesterol molecules. Details about this system can be found in the original paper and the corresponding files are freely available from the APL@Voro website.
- Input files used in tests and/or tutorials:
7.1.1.2. Protein system
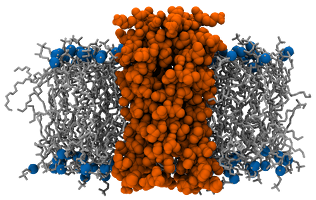
This is originally from Krüger and Fischer but is also mentioned in Lukat et al. as system M3. It is made of Vpu pore embedded in a membrane made of 112 DOPC. This pore results from the aggregation of five VPU1−32 WT peptides and is then not a protein per se. Yet, the size and morphology of this pentameric assembly is comparable to a real trans-membrane protein and the analysis is quite similar. Details about this system can be found in the original paper and the corresponding files are freely available from the APL@Voro website.
- Input files used in tests and/or tutorials:
7.1.1.3. Peptide system
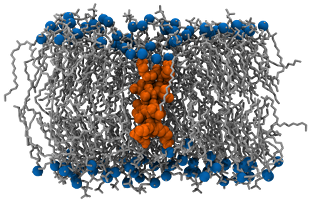
This system is based on work by Kandasamy and Larson and consists of a single trans-membrane KALP15 peptide (sequence: Ac-GKK(LA)4 - LKKA-NH2) embedded in a bilayer made of 126 DPPC.
- Input files used in tests and/or tutorials:
7.1.1.4. Model vesicle
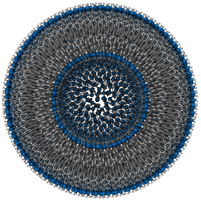
The model vesicle made of 2748 DPPC. It was built ex nihilo by positioning and orienting lipid molecules on two concentric spheres. Because this system is artificially generated, its properties are known: the membrane thickness is set to 5 nm and the area per lipid for both leaflets are set to 40 Å2 (inner) and 64 Å2 (outer), respectively.
- Input files used in tests and/or tutorials:
7.1.1.5. Real vesicle
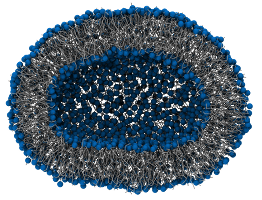
This vesicle (3030 DPPC) was obtained from the self-aggregation of MARTINI lipids.
- Input files used in tests and/or tutorials:
7.1.2. Generating the index file
FATSLiM uses a GROMACS index file to identify the atoms corresponding to lipid headgroup so
every GROMACS users should be at ease and already know how to use the gmx make_ndx utility
provided by GROMACS.
In the following examples, the atom selection along with the index file will be provided to make things as clear as possible. See below for a complete and comprehensive example.
7.2. Tutorial #1: Simple membrane identification
- Goal: Identify leaflets from the lipid-only system and save them to an index file
- Configuration file:
bilayer_chol.gro
7.2.1. Index file
- Atoms selected as headgroups: PO4 for DUPC and DPPC residues and ROH for CHOL residue.
Important
FATSLiM uses these atoms to identify lipids assuming the selected atoms are lipid headgroups. You can select several atoms from the same residue (e.g. PO4 and NC3 beads for Martini phospholipids) without any problem (FATSLiM will just use the center of geometry as the lipid head group position) as long as all the atoms belong to the actual lipid headgroup.
When working with Martini lipids, the most common choice is to choose the phosphate moiety (PO4 bead) to describe phospholipid headgroups. For the cholesterol molecule, the alcool moiety (ROH bead) is usually used.
Before performing analysis, you must create an index file containing these atoms so FATSLiM can identify lipids:
- Launch
gmx make_ndxusingbilayer_chol.groas input file:
gmx make_ndx -f bilayer_chol.gro -o bilayer_chol.ndx
You should see the default groups GROMACS creates:
0 System              : 33624 atoms
1 Other               : 33624 atoms
2 DPPC                :  9936 atoms
3 DUPC                :  6480 atoms
4 W                   : 12600 atoms
5 CHOL                :  4608 atoms
- Create the group to store headgroups. As the PO4 bead and the ROH only belong to the phospholipids and the cholesterol, respectively, you can simply use the following selection string:
a PO4 ROH
This will create a new group:
6 PO4_ROH : 1944 atoms
- Optionally, you can rename this group to be more explicit:
name 6 headgroups
- Finally, you can delete the other groups which are not needed by FATSLiM (this is also completely optional):
del 0-5
- Quit
gmx make_ndxand there should be an index file namedbilayer_chol.ndxthat will be used by FATSLiM
Voilà, you are now ready to use FATSLiM!
7.2.2. Analysis
As, previously described, FATSLiM needs at least two files to perform analysis. Here will be used:
bilayer_chol.growhich will provide the atom coordinates and system topology- bilayer_chol.ndx you created to provide lipid headgroups (a safe version of this file
is available
here)
To identify the leaflets and store them into an index file use the following command:
fatslim membranes -c bilayer_chol.gro -n bilayer_chol.ndx --output-index bilayer_chol_leaflet.ndx
Alternatively, if you did not rename the group in the previous section, you have to specify the name of the group to use in the index file:
fatslim membranes -c bilayer_chol.gro -n bilayer_chol.ndx --output-index bilayer_chol_leaflet.ndx --hg-group PO4_ROH
In both cases, this will create a file named bilayer_chol_leaflet_0000.ndx
which can be used for further processing (e.g. extracting leaflets from your trajectory with gmx trjconv)
Note
The frame index (starting from 0) is appended to the filename as one index file is created per frame. Hence bilayer_chol_leaflet_0000.ndx instead of bilayer_chol_leaflet.ndx
7.3. Tutorial #2: Membrane thickness over trajectory
- Goal: Plotting the membrane thickness over a trajectory
- Configuration file:
bilayer_peptide.gro - Trajectory file:
bilayer_peptide.xtc - Atoms selected as headgroups: P8 (Phosphorus atom)
- Index file:
bilayer_peptide.ndx
Note
Generating the (provided) index file using the atom selection is left as an exercise.
Check the above tutorial if needed.
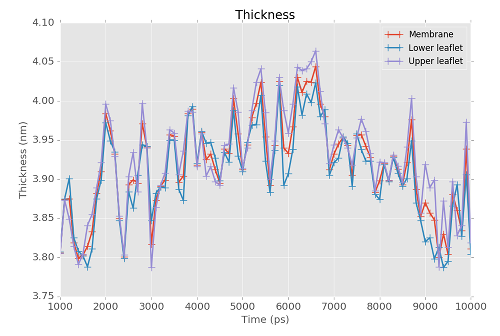
FATSLiM is able to store results into a .xvg file so you can plot them. Here it is used to plot the thickness of a DPPC vesicle over a (pretty small – this is an example!) MD trajectory. Run the following command:
fatslim thickness -c bilayer_peptide.gro -n bilayer_peptide.ndx -t bilayer_peptide.xtc --plot-thickness bilayer_peptide_thickness.xvg
It should give an output similar to this one:
FATSLiM - Fast Analysis Toolbox for Simulations of Lipid Membranes
version 0.2.0
Copyright (c) 2013-2016 Sébastien Buchoux

Running command: 'thickness'... This may take some time, be patient!
Analysis will be performed using 8 threads.
Analysing frame    91/   91 (time: 10000 ps)... done in 5 ms (Remaining: 0 s)
Results:
Average values over 91 processed frames:
Thickness: Membrane=3.916±0.061nm - Lower leaflet=3.907±0.060nm - Upper leaflet=3.926±0.066nm
'bilayer_peptide_thickness.xvg' backed up to 'bilayer_peptide_thickness.xvg'
Thickness values saved to 'bilayer_peptide_thickness.xvg'

'thickness' command executed in 574.271 ms (CPU)
Goodbye!
bilayer_peptide_thickness.xvg was created as a result.
This is a plain text XY plot that can be plot with a vast variety of tool such as Grace or Matplotlib:
7.4. Tutorial #3: Vesicle membrane area and area per lipid
- Goal: Plotting the membrane area and area per lipid of a vesicle over a trajectory
- Configuration file:
dppc_vesicle.gro - Trajectory file:
dppc_vesicle.xtc - Atoms selected as headgroups: PO4 (Phosphate bead)
- Index file:
dppc_vesicle.ndx
Note
Generating the (provided) index file using the atom selection is left as an exercise.
Check the above tutorial if needed.
Rather than running FATSLiM twice (once for membrane area, once for area per lipid), it is possible to run the analysis once and store both results at the same time. Simply run the following command:
fatslim apl -c dppc_vesicle.gro -n dppc_vesicle.ndx -t dppc_vesicle.xtc --plot-apl dppc_vesicle_apl.xvg --plot-area dppc_vesicle_area.xvg
This should give you an output similar to:
FATSLiM - Fast Analysis Toolbox for Simulations of Lipid Membranes
version 0.2.0
Copyright (c) 2013-2016 Sébastien Buchoux

Running command: 'apl'... This may take some time, be patient!
Analysis will be performed using 8 threads.
Analysing frame    11/   11 (time: 5000 ps)... done in 34 ms (Remaining: 0 s)
Results:
Average values over 11 processed frames:
Area per lipid: Membrane=0.677±0.002nm^2 - Outer leaflet=0.793±0.002nm^2 - Inner leaflet=0.496±0.003nm^2
'dppc_vesicle_apl.xvg' backed up to 'dppc_vesicle_apl.xvg'
Area per lipid values saved to 'dppc_vesicle_apl.xvg'

Area: Membrane=1026.241±3.145nm^2 - Outer leaflet=1468.016±3.455nm^2 - Inner leaflet=584.465±2.970nm^2
'dppc_vesicle_area.xvg' backed up to 'dppc_vesicle_area.xvg'
Area values saved to 'dppc_vesicle_area.xvg'

'apl' command executed in 503.603 ms (CPU)
Goodbye!
Two files, dppc_vesicle_apl.xvg and
dppc_vesicle_area.xvg was created as a result.
7.5. Tutorial #4: Extracting raw APL data for further processing
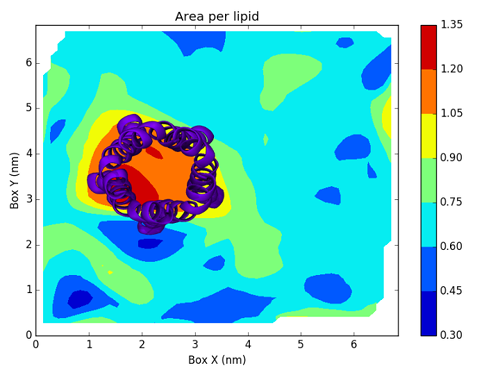
- Goal: Map the area per lipid from a membrane with a protein
- Configuration file:
bilayer_prot.gro - Atoms selected as headgroups: P8 (Phosphorus atom)
- Protein atoms selected: All but hydrogen atoms (Protein-H default group from
gmx make_ndx) - Index file:
bilayer_prot.ndx
7.5.1. Index file
In this tutorial, we need to take into account protein atoms for area per lipid calculation.
As for lipid headgroups, this involves gmx make_ndx:
- Launch
gmx make_ndxusingbilayer_prot.groas input file:
gmx make_ndx -f bilayer_prot.gro -o bilayer_prot.ndx
You should see the default groups GROMACS creates:
 0 System              : 26703 atoms
 1 Protein             :  1520 atoms
 2 Protein-H           :  1250 atoms
 3 C-alpha             :   160 atoms
 4 Backbone            :   480 atoms
 5 MainChain           :   645 atoms
 6 MainChain+Cb        :   805 atoms
 7 MainChain+H         :   805 atoms
 8 SideChain           :   715 atoms
 9 SideChain-H         :   605 atoms
10 Prot-Masses         :  1520 atoms
11 non-Protein         : 25183 atoms
12 Other               :  5824 atoms
13 POPC                :  5824 atoms
14 Water               : 19359 atoms
15 SOL                 : 19359 atoms
16 non-Water           :  7344 atoms
Note that, as a protein is present, the number of groups is greater than previously.
- First, we will handle the lipid headgroups:
r POPC & a P8
and renamed the newly created group to the default name so we do not need to specify if with --hg-group:
name 17 headgroups
- Then, we need to select the protein atoms we need to take into account we calculating area per lipid. In this tutorial, we will use only the heavy atoms but it is a good exercice to test other possibilities (all atoms, only the backbone, etc) to see how the selection affects the area per lipid calculation. In our case, the group of atoms is already defined (group 2) so we just need to rename it (once again this is just to avoid specifying --interacting-group:
name 2 protein
- Optionally, it is also possible to "clean" our index file by deleting the groups we do not need before quitting
gmx make_ndx:
del 0-1
del 1-14
When done, we now have bilayer_prot.ndx that contains only the two groups needed by FATSLiM.
7.5.2. Analysis
Because, we use the default names (headgroups and protein) for the atom groups, we do not need to specify them for FATSLiM to use the correct atom selection and the following command will suffise:
fatslim apl -c bilayer_prot.gro -n bilayer_prot.ndx --export-apl-raw bilayer_prot_apl.csv
This will create a file name bilayer_prot_apl_frame_00000.csv.
Note
As previously, the frame index (starting from 0) is appended to the filename as one csv file is created per frame. Hence bilayer_prot_apl_0000.csv instead of bilayer_prot_apl.csv
For illustration, here are the first lines of the file:
resid,leaflet,X coords,Y coords,Z coords,Area per lipid
161,lower leaflet,1.737,0.835,2.436,0.788
162,lower leaflet,0.849,5.330,2.425,0.652
163,lower leaflet,0.311,4.747,2.344,0.641
164,lower leaflet,1.307,1.249,2.289,0.858
165,lower leaflet,1.399,6.094,2.365,0.676
166,lower leaflet,1.932,6.810,2.461,0.670
167,lower leaflet,1.512,0.350,2.489,0.748
168,lower leaflet,4.374,4.422,2.546,0.746
169,lower leaflet,4.333,5.112,2.494,0.796
7.5.3. Further analysis
As you can see, bilayer_prot_apl_frame_00000.csv contains
all the information we need to create a map with all the area per lipid values.
To actually create this map, we will use a Python script based on Matplotlib.
Writing this script is not directly related to FATSLim and is thus beyond the scope of this tutorial, this is why it will not be discussed here. Nonetheless, it is an example of post-processing that can be achieved using FATSLiM raw results.
You download the script here or just take a look at its content:
1 2 3 4 5 6 7 8 9 10 11 12 13 14 15 16 17 18 19 20 21 22 23 24 25 26 27 28 29 30 31 32 33 34 35 36 37 38 39 40 41 42 43 44 45 46 47 48 49 50 51 52 53 54 55 56 57 58 59 60 61 62 63 64 | #!/usr/bin/env python
# -*- coding: utf8 -*-
import numpy as np
import matplotlib.pyplot as plt
from scipy.interpolate import griddata
CSV_FILENAME = "bilayer_prot_apl_frame_00000.csv"
GRO_FILENAME = "bilayer_prot.gro"
PNG_FILENAME = "bilayer_prot_apl_frame_00000.png"
# Get Box vectors
last_line = ""
with open(GRO_FILENAME) as fp:
for line in fp:
line = line.strip()
if len(line) == 0:
continue
last_line = line
box_x, box_y = [float(val) for val in line.split()[:2]]
# Get values
membrane_property = "Area per lipid"
x_values = []
y_values = []
z_values = []
property_values = []
with open(CSV_FILENAME) as fp:
for lino, line in enumerate(fp):
if lino == 0:
membrane_property = line.split(",")[-1].strip()
else:
line = line.strip()
if len(line) == 0:
continue
resid, leaflet, x, y, z, value = line.split(",")
x_values.append(float(x))
y_values.append(float(y))
property_values.append(float(value))
# Building data from plotting
grid_x, grid_y = np.mgrid[0:box_x:50j, 0:box_y:50j]
points = np.stack((np.array(x_values).T, np.array(y_values).T), axis=-1)
values = np.array(property_values)
grid = griddata(points, values, (grid_x, grid_y), method='cubic')
# Plot map
plt.contourf(grid_x, grid_y, grid)
cbar = plt.colorbar()
plt.title(membrane_property)
plt.xlabel("Box X (nm)")
plt.ylabel("Box Y (nm)")
plt.tight_layout()
plt.savefig(PNG_FILENAME)
|
and the generated figure:
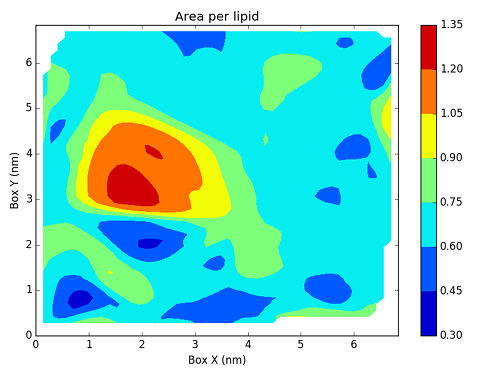
with the protein added: