Template integration
Adding Geoportal’s maps to the templates
Django-geoportail provides a great template library that you can use to display read-only maps in your templates (with or without drawn features). There are two ways to enable this library:
On a project basis: if you need django-geoportail‘s tags in almost every template of your project, you can add in your project’s __init__.py:
from django import template
template.add_to_builtins('geoportal.templatetags.geoportal_tags')
On a per-template basis: simply add this line on the top of the template where you need geoportal’s template tags:
{% load geoportal_tags %}
Loading the javascript library
Once you’ve loaded the template library, you need to load the geoportal javascript library on each page that displays a map. This is achieved by adding the following in the head section of your template:
{% geoportal_js %}
The above code will add a <script> tag that calls the Geoportal library. This has to be done before the geoportal_map tag is called: the javascript library has to be loaded synchronously.
Rendering a map: the {% geoportal_map %} template tag
Syntax:
{% geoportal_map field [option1=value, option2=other_value] [as var_name] %}
Basic usage
geoportal_tags provides a single template tag: the {% geoportal_map %} tag. It takes a required argument and several options.
The required argument is a geographic field. It can be a point, a linestring, a polygon or even a set of polygons or any type of geographic field. The simplest way to display a geographic field is (assuming you have a model_instance variable in your template context):
{% geoportal_map model_instance.geo_field %}
When this template tag is called, django-geoportail renders all the javascript code that is needed to display the field, and renders a map with the default options. With the Polygon I draw in the Example section, the map would look like this:
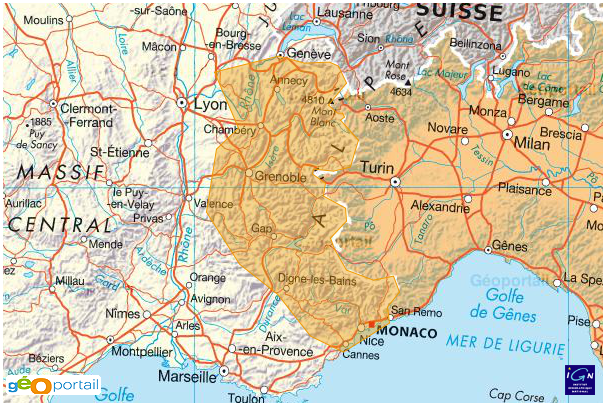
This is a map with the standard dimensions (600x400 pixels), the default feature color (#ee9900) and the default feature opacity (0.4).
Getting the javascript context
When a map is rendered on a template, a random javascript variable is generated and this variable stores the map’s information. If you need to do some further customization, you can get this variable in your template context:
{% geoportal_map geo_field as var_name %}
This will still render the map and you will be able to manipulate it with some javascript code:
<script type="text/javascript">
    {{ var_name }}.viewer.setSize(...);

    {{ var_name }}.viewer.map.setCenter(...);
</script>
Here is the detail of what {{ var_name }} contains:
- viewer a Geoportal.Viewer instance. You can see what it does on the Geoportal API documentation. The viewer.map object (an OpenLayers.Map instance) is especially interesting to manipulate.
- layers: a list of the layers displayed on the map.
{{ var_name }} also contains several function definitions and some internal variables. Feel free to read the generated code and see what’s interesting.
The as var_name argument should always be the last argument. If you need any option (see below), you should always specify them before.
Map options
Specifying options
We’ve seen a standard map but it has to be customized: the feature color is too close to the color of Italy on the map. This is one of the things we can change.
Several options are available. The syntax for all options is the following: each options is a pair key=value, and two pairs must be separated by a comma. Some whitespace can be added since it often improves readability.
Here is an example of rendering a map with option1 set to 1 and option2 set to ff0000:
{% geoportal_map model_instance.geo_field option1=1, option2=ff0000 %}
Option values can be static strings or template variables. If some_value is available in the template context, calling
{% geoportal_map model_instance.geo_field option1=some_value %}
will resolve some_value from the template context. This can be very useful when some parameters have to be dynamic.
Note
Boolean options
Boolean values should be 0 (false) or 1 (true), nothing else.
Map options reference
Here is a full list of the available options and their default values.
- width: the width of the map, in pixels. Default: 600 or the overriden corresponding setting.
- height: the height of the map, in pixels. Default: 400 or the overriden corresponding setting.
- visible: boolean specifying the visibility of the feature on the map. Default is 1 (true), setting it to 0 will display the map centered on the feature but without any more layer.
- color: the color of the feature, in rrggbb format. Default is ee9900 or the overriden corresponding setting.
- opacity: the opacity of the feature (mostly for polygons), float value between 0 (completely transparent) and 1 (no transparency). Default is 0.4 or the overriden corresponding setting.
- zoom: the zoom level to set the map to. The default behaviour is to set the zoom level dynamically so the feature fits completely on the map (or just use settings.GEOPORTAL_POINT_ZOOM for points). However, if you need to force the zoom level this can be achieved easily.
- navigation: boolean specifying whether the navigation should be enabled on the map. Navigation means panning and zooming in or out. The default behaviour is to disable the navigation, this can be changed by setting navigation to 1.
Final example
Let’s finish with an example:
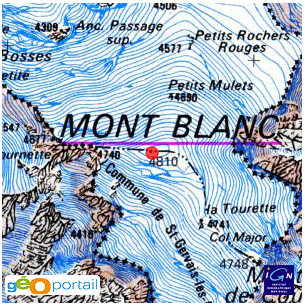
{% geoportal_map model_instance.point color=ff0000, opacity=0.7, zoom=14, width=300, height=300 %}
Here we generate a squared (300x300 pixels) map of a point. The point will be red with a rather high opacity. The zoom level is forced to 14 in case it is overriden in the settings.
The result is, as we can expect (oh, and the point has the coordinates of the Mont Blanc):
Adding external features
In this section, we assume that you have displayed a map on your page using the geoportal_map template tag, and you’ve added it to your template context:
{% geoportal_map my_field as var_name %}
Now, you can render KML and GPX filed with the corresponding template tags.
KML: the {% geoportal_kml %} tag
Syntax:
{% geoportal_kml map_var kml_url [option1=value1, option2=value2 ...] %}
The two required arguments are:
- map_var: this is the template variable containing the map name.
- kml_url: the URL to the KML file. It can be a template variable or a raw string.
Options are comma-separated, using the key=value syntax described in the geoportal_map section. The values can be raw strings or template variables. The available options are:
- focus: a boolean specifying whether to focus the map on the newly added feature or not. Default: 1 (true).
- width: the width of the border of the feature. Default: 2.
- opacity: the opacity of the innner part of the ferature. Default: 0.4 or the value of GEOPORTAL_DEFAULT_OPACITY if you’ve overriden it.
- color: the color of the feature. Default: OpenLayers’ default, or the value of GEOPORTAL_DEFAULT_COLOR if you’ve overriden it.
- popup: a boolean specifying whether to show a popup or not when the user clicks on a feature: if the features of the KML file contain some <description> elements, a popup with the description is displayed when the user clicks on the feature. Default: 1 (true).
- extract: a boolean specifying whether the KML attributes and styles should be extracted from the feature. Default is 1 (true), you may want to switch it off for better performance if you render a lot (hundreds) of features or if you want to style the features yourself.
Note
On style extraction
If you don’t specify any options, the feature will be styled according to the KML file you’re loading. If you specify any styling option manually, no style will be extracted from the feature. That means you can’t specify extract=1 and width=4 at the same time for example. Setting any other option will autmatically set extract to 0 and the remaning ones to to their default values.
GPX: the {% geoportal_gpx %} tag
Syntax:
{% geoportal_gpx map_var gpx_url [option1=value1, option2=value2 ...] %}
Like with the geoportal_kml tag, you need to specify the map variable and the URL of the GPX file.
The available options are:
- focus: a boolean specifying whether to focus the map on the newly added feature or not. Default: 1 (true).
- color: the color of the GPX feature. Default: OpenLayers’s default or the value of GEOPORTAL_DEFAULT_COLOR.
- opacity: the opacity to apply to the stroke of the feature, unlike the opacity parameter of the KML tag. Default: 1.
- width: the width of the stroke, in pixels. Default: 2.
- popup: a boolean specifying whether to show a popup or not when the user clicks on a feature: if the features of the GPX file contain some <desc> elements, a popup with the description is displayed when the user clicks on the feature. Default: 1 (true).
Note
On focus
If you add several KML/GPX features to the map, make sure the focus parameter is set to 1 only once. If not, the map rendering can become unpredictable.