JqPyCharts.main_code
Overview
This module is the main JqPyCharts code module
JqPyCharts: Usage
JqPyCharts is simple to use.
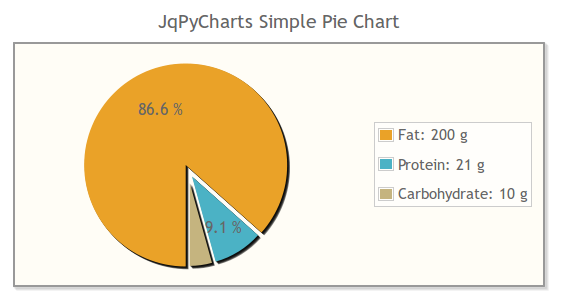
JqPyCharts: Simple Pie Chart Usage
Define a HTML template
There are many ways to do this.
Python-Example
html_template = '''
<!DOCTYPE html>
<html>
   <head>
{js_css_resources_header}
{jqplotchart_script1}
   </head>
   <body>
      <br>
      {html_chart_insert_tag1}
      <br>
   </body>
</html>
'''
Get the Simple Pie Chart data and write the html file
Python-Example
js_css_resources_header1, jqplotchart_script1, html_chart_insert_tag1 = jqpc_simple_pie_chart(
   absolute_source_dir_path=path_abspath('scripts'),
   script_src_tag_dir_path='scripts',
   chart_id='id_1',
   chart_title='JqPyCharts Simple Pie Chart',
   chart_data_matrix=[
      ('Fat', 200, '#EAA228', 'Fat: 200 g'),
      ('Protein', 21, '#4bb2c5', 'Protein: 21 g'),
      ('Carbohydrate', 10, '#c5b47f', 'Carbohydrate: 10 g')
   ],

   highlighter_prefix='Grams',
   background='#fffdf6',
   legend_font_px=15,
   data_label_threshold=9.0,
   width_px=550,
   height_px=300,
   margin_top_px=0,
   margin_bottom_px=0,
   margin_right_px=0,
   margin_left_px=0
)

example_final_html_code = html_template.format(
   js_css_resources_header=js_css_resources_header1,
   jqplotchart_script1=jqplotchart_script1,
   html_chart_insert_tag1=html_chart_insert_tag1,
)

with open('usage_example__simple_pie_chart.html', 'w') as file_:
   file_.write(example_final_html_code)
This will look like:
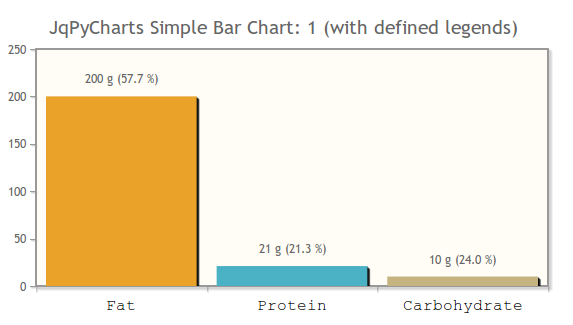
JqPyCharts: Simple Bar Chart Usage
Define a HTML template
There are many ways to do this.
Python-Example
html_template = '''
<!DOCTYPE html>
<html>
   <head>
{js_css_resources_header}
{jqplotchart_script1}
   </head>
   <body>
      <br>
      {html_chart_insert_tag1}
      <br>
   </body>
</html>
'''
Get the Simple Bar Chart data and write the html file
Python-Example
horizontal set to False
js_css_resources_header1, jqplotchart_script1, html_chart_insert_tag1 = jqpc_simple_bar_chart(
   absolute_source_dir_path=path_abspath('scripts'),
   script_src_tag_dir_path='scripts',
   chart_id='id_1',
   class_str='',
   chart_title='JqPyCharts Simple Bar Chart: 1 (with defined legends)',
   chart_x_label='',
   chart_x_label_fontdict=None,
   chart_ticks_fontdict=None,
   chart_data_matrix=[
      ('Fat', 200, '#EAA228', '200 g (57.7 %)'),
      ('Protein', 21, '#4bb2c5', '21 g (21.3 %)'),
      ('Carbohydrate', 10, '#c5b47f', '10 g (24.0 %)')
   ],
   highlighter_prefix='Grams',
   background='#fffdf6',
   horizontal=False,
   draw_grid_lines=False,
   width_px=550,
   height_px=300,
   margin_top_px=0,
   margin_bottom_px=0,
   margin_right_px=0,
   margin_left_px=0
)

example_final_html_code = html_template.format(
   js_css_resources_header=js_css_resources_header1,
   jqplotchart_script1=jqplotchart_script1,
   html_chart_insert_tag1=html_chart_insert_tag1,
)

with open('example__simple_bar_chart.html', 'w') as file_:
   file_.write(example_final_html_code)
This will look like:
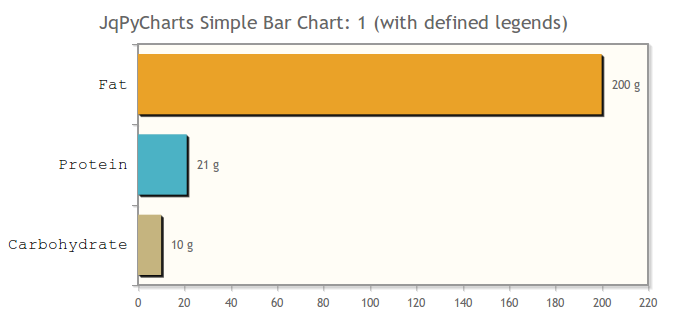
Python-Example
horizontal set to True
js_css_resources_header1, jqplotchart_script1, html_chart_insert_tag1 = jqpc_simple_bar_chart(
   absolute_source_dir_path=path_abspath('scripts'),
   script_src_tag_dir_path='scripts',
   chart_id='id_1',
   class_str='',
   chart_title='JqPyCharts Simple Bar Chart: 1 (with defined legends)',
   chart_x_label='',
   chart_x_label_fontdict=None,
   chart_ticks_fontdict=None,
   chart_data_matrix=[
      ('Fat', 200, '#EAA228', '200 g'),
      ('Protein', 21, '#4bb2c5', '21 g'),
      ('Carbohydrate', 10, '#c5b47f', '10 g')
   ],
   highlighter_prefix='Grams',
   background='#fffdf6',
   horizontal=True,
   draw_grid_lines=False,
   width_px=650,
   height_px=300,
   margin_top_px=0,
   margin_bottom_px=0,
   margin_right_px=0,
   margin_left_px=0
)

example_final_html_code = html_template.format(
   js_css_resources_header=js_css_resources_header1,
   jqplotchart_script1=jqplotchart_script1,
   html_chart_insert_tag1=html_chart_insert_tag1,
)

with open('usage_example__simple_bar_horizontal_chart.html', 'w') as file_:
   file_.write(example_final_html_code)
This will look like:
Functions
- JqPyCharts.main_code.jqpc_get_resources_dict(resource_dict_name)
Returns the defined: resource_dict
Parameters: resource_dict_name – (str) name of resource_dict Returns: (dict) dictionary with b85encode files Raises Err:
- JqPyCharts.main_code.jqpc_write__resource_dict(dict_name, absolute_source_dir_path, force=False)
Helper: writes a complete resource dict to path absolute_source_dir_path: decodes it to separate files If ‘absolute_source_dir_path does not exist it will be created (inclusive intermediate folders)
Parameters: - dict_name – (str) name of resource dict
- absolute_source_dir_path – (str) absolute path to folder
- force – (bool) if True overwrites any existing files
Raises Err:
- JqPyCharts.main_code.jqpc_write__selected_resources(dict_name, list_of_resource_names, absolute_source_dir_path, force=False)
Helper: writes selected resources to path absolute_source_dir_path: decodes it to separate files If ‘absolute_source_dir_path does not exist it will be created (inclusive intermediate folders)
Parameters: - dict_name – (str) name of resource dict
- list_of_resource_names –
(list) list of resources
jqpc_write__selected_resources(
   'JQPLOT_SCRIPTS',
   ['jquery.min.js',
   'jqplot.canvasTextRenderer.min.js'],
   '/out_dir_resource'
)
- absolute_source_dir_path – (str) absolute path to folder if it does not exist it will be created
- force – (bool) if True overwrites any existing files
Raises Err:
- JqPyCharts.main_code.jqpc_get_html_js_css_resources(list_of__resource_names, absolute_source_dir_path, script_src_tag_dir_path, indent='')
Returns a html string with the javascript / css resources
Parameters: - list_of__resource_names – (list) list of resources
- absolute_source_dir_path – (str) absolute path to folder where all the resources are
- script_src_tag_dir_path –
(str) absolute or relative path to folder where all the resources are
Warning
all resources defined in list_of_resource_names: must be in the folder
The script src tag will use the given script_src_tag_dir_path string
- indent – (str) empty string or spaces: moves the inserted text (lines) to the left
Returns: (str) html string
Javascripts:
<script type="text/javascript" src="script_src_tag_dir_path/jquery.min.js"></script>
css:
<link rel="stylesheet" type="text/css" href="script_src_tag_dir_path/jquery.jqplot.min.css">
Raises Err:
- JqPyCharts.main_code.jqpc_get_html_chart_div(chart_id, width_px=300, height_px=300, margin_top_px=0, margin_bottom_px=0, margin_right_px=0, margin_left_px=0, indent='', class_str='')
Returns a html string with the html tag for the chart
Parameters: - chart_id – (str) id of the chart this must match the one in the script
- width_px – (int) Sets the chart width in pixels
- height_px – (int) Sets the chart height in pixels
- margin_top_px – (int) Sets the top margin of an element in pixels
- margin_bottom_px – (int) Sets the bottom margin of an element pixels
- margin_right_px – (int) Sets the right margin of an element pixels
- margin_left_px – (int) Sets the left margin of an element pixels
- indent – (str) empty string or spaces: moves the inserted text (line) to the left
- class_str – (str) empty string or a string which is used as a html class for css styling
Returns: (str) html string
<div id="id_1" class='my-pie-charts' style="width:550px; height:300px; margin-top:20px; margin-bottom:0px; margin-right:20px; margin-left:0px;"></div>
- JqPyCharts.main_code.jqpc_get_html_jqplotchart_script(chart_id, extra_variables_lines_dict, jqplot_options_txt, enable_plugins=True, base_indent='')
Returns a html string with the html tag for the chart
Parameters: - chart_id – (str) id of the chart this must match the one in the script
- extra_variables_lines_dict –
(dict) of extra variables code per line without indent
- key: must be the variable name
Note
for the main data there must be a variable named: chart_data which will be passed on to: jQuery.jqplot
- chart_data value must be a list (or list of lists) with the main chart data
- jqplot_options_txt – (str) the charts main parameters: formatted ready indented string
- enable_plugins –
(bool) effects the line before any the jqplot_options_txt
$.jqplot.config.enablePlugins = true;
- base_indent –
(str) empty string or spaces: moves the inserted text (lines) to the left
- lines of the jqplot_script are indented in relation to each others with a default indent of 3 spaces
Returns: (str) html chart script string
Raises Err:
- JqPyCharts.main_code.jqpc_simple_pie_chart(absolute_source_dir_path='', script_src_tag_dir_path='', chart_id='', class_str='', chart_title='', chart_data_matrix=None, highlighter_prefix='', background='#fffdf6', legend_font_px=15, data_label_threshold=9.0, width_px=300, height_px=300, margin_top_px=0, margin_bottom_px=0, margin_right_px=0, margin_left_px=0)
Returns all (js_css_resources_header, jqplotchart_script, html_chart_insert_tag) for a simple pie chart
uses default indent
Parameters: - absolute_source_dir_path – (str) absolute path to folder where all the resources will be stored. (if resource files exist it will skip writing them)
- script_src_tag_dir_path – (str) absolute or relative path to folder where all the resources are
- chart_id – (str) id of the chart this must match the one in the script: can not contain spaces
- class_str – (str) empty string or a string which is used as a html class for css styling
- chart_title – (str) title
- chart_data_matrix –
(list of tuples) FORMAT: (SeriesName, SeriesValue, SeriesColor, SeriesLegendText)
Note
SeriesLegendText
- if SeriesLegendText is an empty string then the SeriesName is used as legend
- if any SeriesLegendText is defined as None than the legend is skipped all together
chart_data_matrix = [
   ('Fat', 200, '#EAA228', 'Fat: 86100 g'),
   ('Protein', 21, '#4bb2c5', 'Protein: 33600 g'),
   ('Carbohydrate', 10, '#c5b47f', 'Carbohydrate: 37800 g')
]

chart_data_matrix = [
   ('Fat', 200, '#EAA228', ''),
   ('Protein', 21, '#4bb2c5', ''),
   ('Carbohydrate', 10, '#c5b47f', '')
]

chart_data_matrix = [
   ('Fat', 200, '#EAA228', None),
   ('Protein', 21, '#4bb2c5', None),
   ('Carbohydrate', 10, '#c5b47f', None)
]
- highlighter_prefix – (str) prefix for the highlighter text or empty string
- background – (web color or transparent) chart background: ‘#fffdf6’, ‘transparent’
- legend_font_px – (int) Sets ant chart legend font size in pixels
- data_label_threshold – (float)
- width_px – (int) Sets the chart width in pixels
- height_px – (int) Sets the chart height in pixels
- margin_top_px – (int) Sets the top margin of an element in pixels
- margin_bottom_px – (int) Sets the bottom margin of an element pixels
- margin_right_px – (int) Sets the right margin of an element pixels
- margin_left_px – (int) Sets the left margin of an element pixels
Returns: (tuple) js_css_resources_header, jqplotchart_script, html_chart_insert_tag
Raises Err:
- JqPyCharts.main_code.jqpc_simple_bar_chart(absolute_source_dir_path='', script_src_tag_dir_path='', chart_id='', class_str='', chart_title='', chart_x_label='', chart_x_label_fontdict=None, chart_ticks_fontdict=None, chart_data_matrix=None, highlighter_prefix='', background='#fffdf6', horizontal=False, draw_grid_lines=False, width_px=300, height_px=300, margin_top_px=0, margin_bottom_px=0, margin_right_px=0, margin_left_px=0)
Returns all (js_css_resources_header, jqplotchart_script, html_chart_insert_tag) for a simple pie chart
uses default indent
Parameters: - absolute_source_dir_path – (str) absolute path to folder where all the resources will be stored. (if resource files exist it will skip writing them)
- script_src_tag_dir_path – (str) absolute or relative path to folder where all the resources are
- chart_id – (str) id of the chart this must match the one in the script: can not contain spaces
- class_str – (str) empty string or a string which is used as a html class for css styling
- chart_title – (str) title
- chart_x_label – (str) label
- chart_x_label_fontdict –
(dict or None) KEYS:
- fontFamily: (str): e.g. ‘Helvetica’
- fontSize (int): e.g. 15
- textColor (web color or transparent): e.g. ‘#fffdf6’
Note
if None than the defined default values will be used: see the code
- chart_ticks_fontdict –
(dict or None): KEYS:
- fontFamily: (str): e.g. ‘Helvetica’
- fontSize (int): e.g. 15
- textColor (web color or transparent): e.g. ‘#fffdf6’
Note
if None than the defined default values will be used: see the code
- chart_data_matrix –
(list of tuples) FORMAT: (SeriesName, SeriesValue, SeriesColor, SeriesLegendText)
Note
SeriesLegendText
- if SeriesLegendText is an empty string nothing is plotted
chart_data_matrix = [
   ('Fat', 200, '#EAA228', 'Fat: 86100 g'),
   ('Protein', 21, '#4bb2c5', 'Protein: 33600 g'),
   ('Carbohydrate', 10, '#c5b47f', 'Carbohydrate: 37800 g')
]

chart_data_matrix = [
   ('Fat', 200, '#EAA228', ''),
   ('Protein', 21, '#4bb2c5', ''),
   ('Carbohydrate', 10, '#c5b47f', '')
]
- highlighter_prefix – (str) prefix for the highlighter text or empty string
- background – (web color or transparent) chart background: ‘#fffdf6’, ‘transparent’
- horizontal – (bool) if True the bars are drawn horizontal
- draw_grid_lines – (bool) if True the grid lines are drawn
- width_px – (int) Sets the chart width in pixels
- height_px – (int) Sets the chart height in pixels
- margin_top_px – (int) Sets the top margin of an element in pixels
- margin_bottom_px – (int) Sets the bottom margin of an element pixels
- margin_right_px – (int) Sets the right margin of an element pixels
- margin_left_px – (int) Sets the left margin of an element pixels
Returns: (tuple) js_css_resources_header, jqplotchart_script, html_chart_insert_tag
Raises Err: