Plotterx
-
class
decida.Plotterx.Plotterx(parent=None, **kwargs)¶ Bases:
decida.ItclObjectx.ItclObjectx,Tkinter.Framesynopsis:
Graphical user-interface to plot equation sets.
Plotterx is a graphical user-interface to plot the left-hand-side variables of a set of equations, specified in a text-window in the panel.
Cartesian, parametric, polar or polar-parametric curves can be specified and plotted. The equation set and parameters can be saved to a script which, when invoked, puts up the same Plotterx window.
The DeCiDa application plotter simply instantiates one Plotterx object.
constructor arguments:
parent (Tkinter handle)
handle of frame or other widget to pack plot in. if this is not specified, top-level is created.**kwargs (dict)
configuration-optionsconfiguration options:
verbose (bool, default=False)
Enable or disable verbose modeplot_width (str, default=”5i”)
Plot width, specified in Tk inch or pixel unitsplot_height (str, default=”5i”)
Plot height, specified in Tk inch or pixel unitsplot_type (str, default=”cartesian”)
- Plot type: one of “cartesian”, “cartesian-parametric”,
- “polar”, or “polar-parametric”
- Cartesian plots: y vs x, require specification of an x variable to vary, its range, and a y variable.
- Parametric plots: y(t) vs x(t), require specification of a parameter variable to vary, its range, and x and y variables to plot.
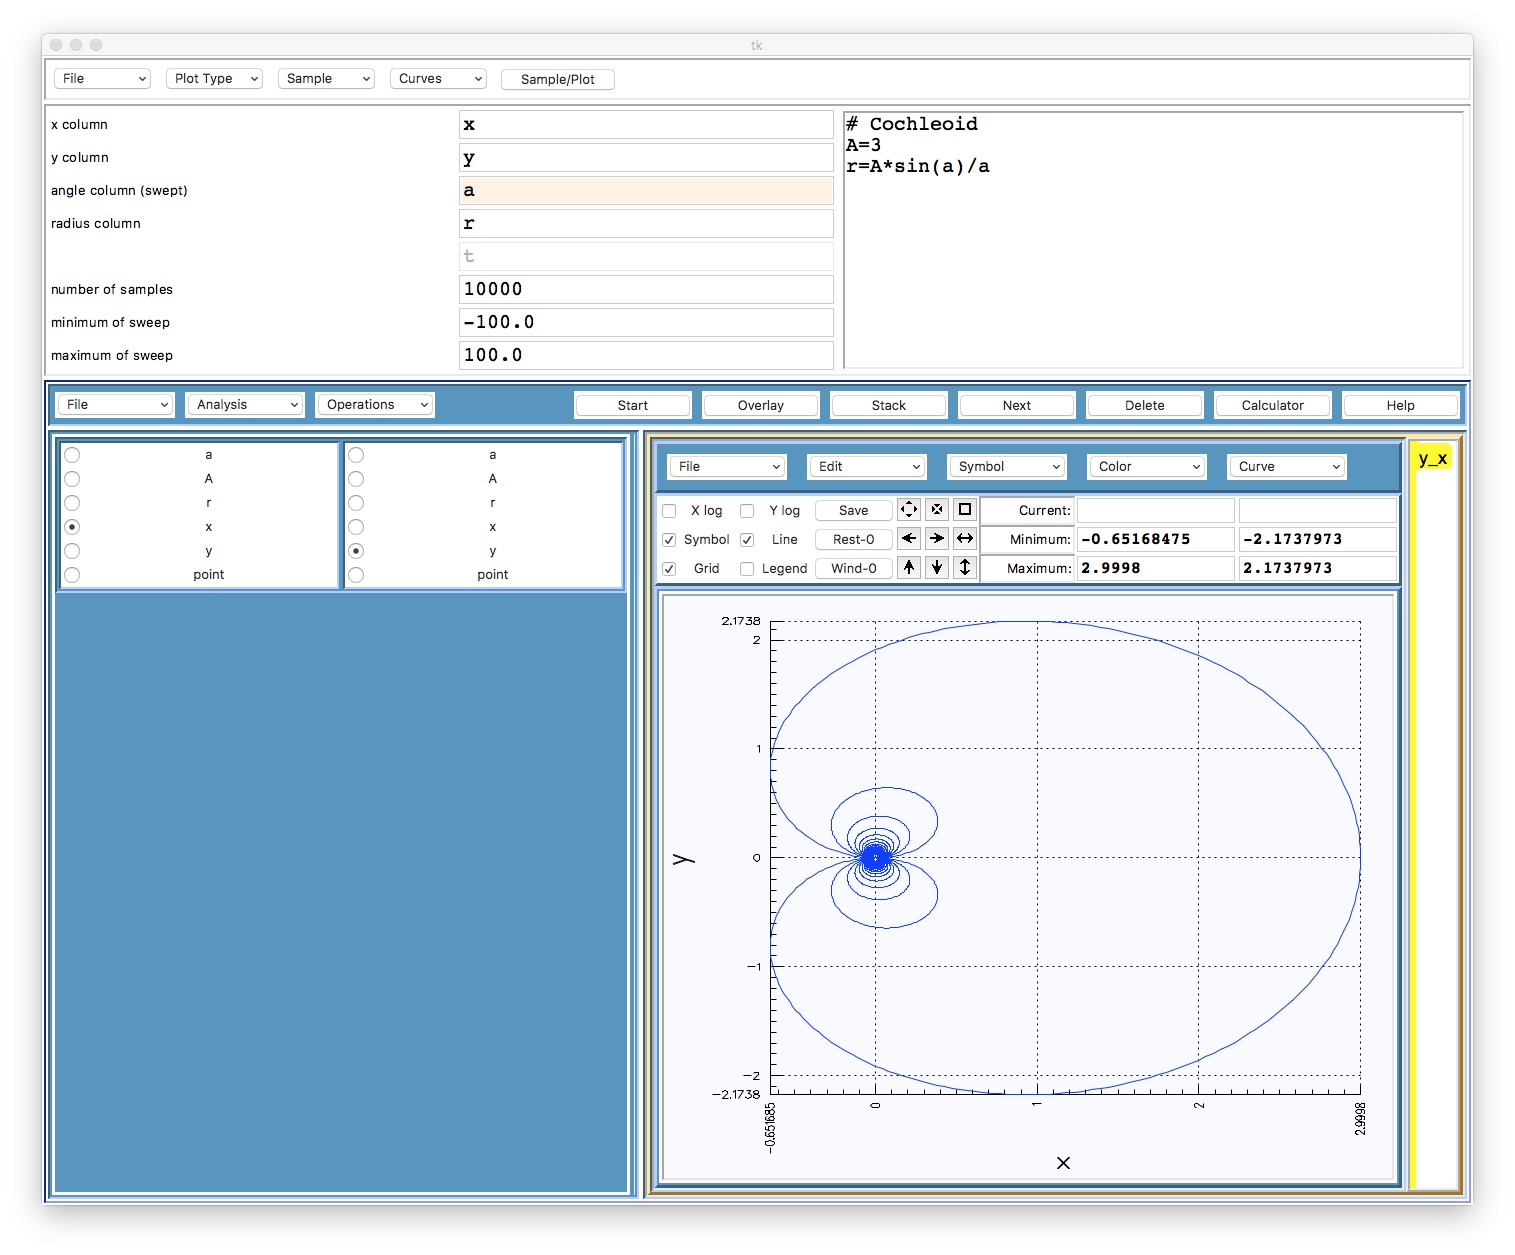
- Polar plots: r(a) require specification of an angle variable to vary, its range, and a radius variable. x(r,a) and y(r,a) are plotted.
- Polar-parametric plots: r(t), a(t), require specification of a parameter variable to vary, its range, and angle and radius variables. x(r,a) and y(r,a) are plotted.
sample_type (str, default=”linear”)
Sample type: one of “linear”, or “logarithmic”
- linear sampling: equally-spaced samples from the minimum to maximum values of the varied variable or parameter
- logarithmic sampling: the parameter is varied according to (maximum_value/minimum_value)^(i/(number_of_points - 1)), for i in range(0, number_of_points)
xcol (str) (default=”x”)
x-axis column (sweep for caresian plots)ycol (str) (default=”y”)
y-axis columnacol (str) (default=”a”)
angle column (sweep for polar plots)rcol (str) (default=”r”)
radius column (for polar and polar-parametric plots)tcol (str) (default=”t”)
- parameter column (sweep for cartesian-parametric and
- polar-parametric plots)
npts (int) (default=1000)
number of sample pointsmin (float) (default=0.0)
minimum of samplingmax (float) (default=5.0)
maximum of samplingexample: (from test_Plotterx)
from decida.Plotterx import Plotterx
Plotterx(ycol="v", xcol="time", equations="v=sin(time*3)")
public methods:
- public methods from ItclObjectx