
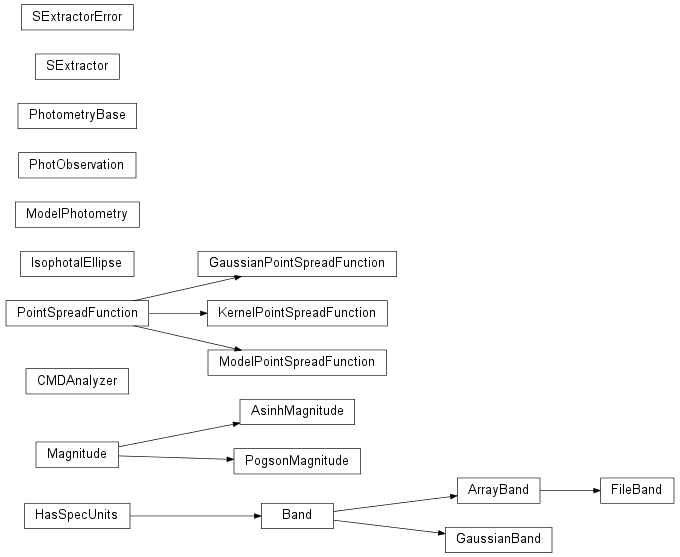
The phot module contains classes and functions for photometry or other image-based flux measurements.
Bases: astropysics.phot.Band
generate a Band from a supplied quantum (e.g. photonic) response function
if the response function is ever negative, the band will be offset so that the lowest point is 0 . If the band x-axis is not sorted, it will be sorted from lowest to highest.
Bases: astropysics.phot.Magnitude
Bases: astropysics.spec.HasSpecUnits
This class is the base of all photometric band objects. Bands are expected to be immutable once created except for changes of units.
The response functions should be photon-counting response functions (see e.g. Bessell et al 2000).
Subclasses must implement the following methods:
initialize the object
return the center of band
return the FWHM of the band
return an array with the x-axis
return the photon sensitivity (shape should match x)
units support (see astropysics.spec.HasSpecUnits)
the following can be optionally overriden:
return the sensitivity of the Band interpolated to the provided x-array
return the provided sensitivity interpolated onto the x-array of the Band
interpolates the Band sensitivity onto the provided x-axis
x can either be an array with the wanted x-axis or a Spectrum if it is a spectrum, the units for the band will be converted to the Spectrum units before alignment
interpolation can be ‘linear’ or ‘spline’
Interpolates the provided function onto the Band x-axis. Input arguments can be of the following forms:
assume that the provided sequence fills the band and interpolate it onto the Band coordinates
if specobj is of type astropyics.spec.Spectrum, the spectrum’s flux will be returned aligned to the band, in the units of the Band
the function with coordinates (x,y) will be aligned to the Band x-axis
see alignBand() for interpolation types/options
compute the flux in this band for the supplied Spectrum
the Spectrum is aligned to the band if aligntoband is True, or vice versa, otherwise, using the specified interpolation (see Band.alignBand for interpolation options). If aligntoband is None, the higher of the two resolutions will be left unchanged
if overlapcheck is True, a ValueError will be raised if most of the Spectrum does not lie within the band
the spectrum units will be converted to match those of the Band
the spectrum can be an array, but then aligntoband and interpolation are ignored and must match the band’s x-axis
Compute the magnitude of the supplied Spectrum in this band using the band’s zptflux attribute
args and kwargs go into Band.computeFlux
use the supplied Spectrum as a zero-point Spectrum to define the zero point of this band as well as the flux for that zero-point
args and kwargs are the same as those for computeMag
determes if this Band overlaps on a significant part of the provided spectrum (that is, if center+/-fwhm overlaps)
this plots the requested band and passes kwargs into matplotlib.pyplot.plot OR if spec is provided, the spectrum will be plotted along with the band and the convolution
keywords
- clf
clear the figure before plotting
- leg
show legend where appropriate
Bases: object
This class is intended to take multi-band photometry and compare it to fiducial models to find priorities/matches for a set of data from the same bands
fiducial is a B x N array where B is the number of bands/colors and N is the number of fiducial points.
fbands specifies the band (either as a string or a Band object) or color name (seperated by “-”) matching the fiducial
fidname is a string or a dictionary that maps fiducial names to indecies in the fidcuial array. If a dictionary, each index must be in one of the values (but not in more than one)
The center of the data for prioritizing based on distance
clears the offsets for setting of properties without recalculation
see getData and setData
Group numbers for the objects - will be cast to ints. Typical meanings: 0 -> don’t use in spectrum -1 -> alignment or guide star
Names for the objects - default is in numerical order starting at 1
The distance to use in calculating the offset between the fiducial values and the data
The distance modulusto use in calculating the offset between the fiducial values and the data
Retreives fiducial data values in a particular band.
i is either an index into the bands, or a band name.
fidname specifies which fiducial sequence to use (or if None, the full array for the requested band will be returned)
computes and returns the CMD offsets
The physical location of the data for prioritizing based on distance
Weights to apply to the location while calculating the offset.
this selects the bands or colors to use in determining offsets as a list of band names/indecies (or for colors, ‘b1-b2’ or a 2-tuple) if None, all the bands will be used directly.
Weights to apply to bands while calculating the offset. Note that this will be invalidated whenever the offsetbands change
if None, no weighting will be done. otherwise, offsetweights must be a sequence of length equal to offsetbands. positibe values will be interpreted as raw scalings (i.e. offset=w*(dat-fid) ) and negative values will be compared to the total range (i.e. offset=-w*(dat-fid)/(max-min) )
this plots the two bands specified by bx and by
clf determines if the figure should be cleared before plotting
skwargs are passed into pylab.scatter and lkwargs are passed into pylab.plot
This loads the data to be compared to the fiducial sequence - the input can be an array (B X N) or an
Bases: astropysics.phot.ArrayBand
type can be ‘txt’, or ‘fits’, or inferred from extension
if txt, first column should be lambda, second should be response
Bases: astropysics.phot.Band
center is the central wavelength of the band, while width is the sigma (if positive) or FWHM (if negative)
Bases: astropysics.phot.PointSpreadFunction
fits the image using a moment analysis - returns (cenx,ceny),[sigx,sigy]
Bases: object
Generates best fit ellipses for an image
returns major axis length in image coordinates
returns major/minor axis ratio
returns major axis length in image coordinates
returns the full ellipse as an (x,y) tuple
returns eccentricity
returns the difference between the fitted ellipse and the flux level
The pixels to keep for fitting, either as a fraction of the total (if less than 1) or as a fixed number of pixels (if greater than 1)
returns major axis length in image coordinates
returns major axis length in image coordinates
returns rotation angle clockwise from x-axis
returns the full ellipse as an (rho,theta) tuple
Bases: astropysics.phot.PointSpreadFunction
uses Bell&DeJong 01 relations - note that this is intended for normal spiral stellar pops
color can either be a ‘B-V’,’B-R’,’V-I’,’V-J’,’V-H’,or ‘V-K’
returns tuple of mass-to-light ratios for each c as (mlrb,mlrv,mlrr,mlri,mlrJ,mlrH,mlrK)
Uses Bell 2003 relations derived from SDSS to compute the mass-to-light ratio of a galaxy goven it’s color
| Parameters: |
|
|---|---|
| Returns: | tuple of mass-to-light ratios in each band (mlrg,mlrr,mlri,mlrz,mlrJ,mlrH,mlrK) for each color. |
Uses Bell & DeJong 2001 relations to compute stellar mass - note that this is intended for normal spiral stellar pops.
| Parameters: |
|
|---|---|
| Returns: | Stellar mass derived using the each possible color as well as the mean, in a tuple (meanmstar,(B-derived,V-derived,R-derived,I-derived)). |
Uses Bell 2003 relations derived from SDSS - computes stellar mass given magnitudes for a galaxy.
Bases: object
Bases: object
Represents a astropysics.models 2D model of the photometric flux from an image.
The normparam attribute defines which model parameter sets the overall scaling. If None, the scaling methods will not function.
computes the radius in which half the flux is encircled. kwargs are passed into FunctionModel2DScalar.getFluxRadius
Simulate how this model would appear on an image.
pixels is a 2D array that described the number of pixels to use, a scalar describing the number of pixels in both directions, or a sequence (npixx,npixy)
scale is either a scalar giving the pixel scale or a 2-sequence (xscale,yscale) as units/pixel
background is a scalar background level to assume or a 2D array of matching shape as the simulation
noise can be:
no noise is applied
assumes the flux units are counts and returns the poisson noise model
uniform gaussian noise with the scalar as sigma
gaussian noise with the value at each array point as sigma - array dimension must match simulation
will be called as noise(imagearr2d) and should return the value of the model+noise
psf is the point-spread function to be applied before the noise, either a scalar/2-tuple for a gaussian PSF (specifies the FWHM in actual units, not pixels), or a 2D measured PSF to convolve with the model. If None, no psf will be included.
sampling is passed into the model’s pixelize method (see FunctionModel2DScalar.pixelize())
Bases: astropysics.phot.PointSpreadFunction
kwargs are passed into the model fitData method
Bases: object
A photometric measurement (or array of measurements) in a fixed group of bands. These bands must be present in the band registry.
the first index of the values must have length equal to nbands
if asmags is True, values and errs will be interpreted as magnitudes, otherwise, flux
photmetric measurements in flux units
photmetric errors in flux units
Extracts the center and FWHM of the bands in these observations
returns x,w
compute an approximate flux density (e.g. erg cm^-2 s^-1 angstrom^-1) assuming flat over the FWHM
photmetric measurements in magnitudes
photmetric errors in magnitudes
Plots these photometric data points.
fluxtype can be:
either magnitude or flux depending on the input type
magnitudes
flux in 
flux spectral density e.g. 
kwargs go into matplotlib.pyplot.errorbar
converts this data set to a Spectrum
TODO: fill in gaps assuming a flat spectrum
Bases: object
A base class for objects that perform photometric measurements from an image.
Subclasses should:
all outputs will be in magnitudes with the zeropoint set by the zeropoint attribute if usemags is True, otherwise they will be
Performs the primary computationally-intensive phase of the photometric measurement.
kwargs will be set as attributes on this object
If set to None, zeropoint comes from image
Bases: astropysics.phot.Magnitude
Bases: object
Represents a Point Spread Function (PSF) for an image.
Coordinate system is always in pixel coordinates
Convolve this psf with the supplied 2D Array.
background sets the value of the background to assume around the edges.
set the PSF parameters from the provided 2D image array
Bases: object
This class is an adaptor to the Sextractor program (Bertin & Arnouts 1996, http://astromatic.iap.fr/software/sextractor/). Sextractor must be installed and on the path for this class to function.
options are set by changing values in the options dictionary
output parameters are chosen by setting True/False values in the params dictionary
returns the dictionary of input options and the associated information
if aslist is True, returns an list of
returns a list of all options. If incval is True, returns a list of tuples of the form (optionname,optionvalue)
returns the dictionary of parameters and the associated information
returns a list of all selected parameters
writes configuration files and runs sextractor on the input image
mode can be:
Bases: exceptions.Exception
This function transforms UBVRI (Johnson-Cousins) photometry to the SDSS system, using the transformations of Jester et al. (2005). If only UBV is available, only ugr can be derived (set R and I to 0).
| Parameters: |
|
|---|---|
| Returns: | (u,g,r,i,z) magnitudes in the requested SDSS system as a tuple of scalars or arrays (depending on the type of the inputs) |
computes absolute magnitude from apparent magnitude and distance. See distance_modulus() for details on arguments
computes apparent magnitude from absolute magnitude and distance. See distance_modulus() for details on arguments
Compute the surface brightness given a particular magnitude and area in mag/sq arc seconds
This function is used to change the magnitude system used where magnitudes are used in astropysics. It can be:
![M = -2.5 \log_10(e) [{\rm asinh}(x/2b)+\ln(b)]](../_images/math/a1ada87734ac3eeefd3e6c94c366a5b81f98d874.png)
estimate color to effective temperature - currently only g-r is available from McGurk 10 or B-V from Sekiguchi & Fukugita 00
transforms a color as band1mag-band2mag into a flux ratio flux1/flux2
this will use the supplied spectrum to determine the magnitude zero points for the specified bands OR scale the zeropoint
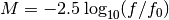
computes
mag determines if mag/as^2 is used or if False, flux
Compute the luminosity distance given the specified distance modulus.
| Parameters: |
|
|---|---|
| Returns: | luminosity distance in pc if ddm is None, else (d,duppererror,dlowererror) |
Compute the distance modulus given a distance or redshift.
| Parameters: |
|
|---|---|
| Returns: | If dx is None, returns distance modulus (or array of distance moduli). Otherwise, returns (dm,dmuppererror,dmlowererror) |
transforms a flux ratio band1flux/band2flux to a color band1mag-band2mag
this converts a flux measurement to a specific intensity assuming the source is a sphere of a specified radius at a specified distance (in the same units)
converts photon count intensities (i.e. photon cm^-2 sr^-1) to signficance values from poisson statistics.
Is is intensity of the signal In is intensity of the background
this converts a specific intensity measurement to a flux assuming the source is a sphere of a specified radius at a specified distance (in the same units)
Uses the Blanton et al. 2003 k-correction
requires pidly (http://astronomy.sussex.ac.uk/~anthonys/pidly/) and IDL with kcorrect installed
input magnitudes should be of dimension (nfilter,nobj), as should magerr zs should be sequence of length nobj if magerr is None,
returns absmag,kcorrections,chi2s
Calculate absolute magnitude from a luminosity.
| Parameters: |
|
|---|---|
| Returns: | Absolute magnitude if Lerr is None, otherwise (mag,magerr) tuple (error assumes normal approximation). |
Valculate a luminosity from an absolute magnitude.
| Parameters: |
|
|---|---|
| Returns: | Luminosity if Lerr is None, otherwise (lum,lumerr) tuple (error assumes normal approximation). |
Note
Mzpt as a string can be ‘U’,’B’,’V’,’R’,’I’,’J’,’H’, or ‘K’ and will use B&M values for solar magnitudes or ‘u’,’g’,’r’,’i’, or ‘z’ from http://www.ucolick.org/~cnaw/sun.html
Plot a group of bands on the same plot using matplotlib
group can be a sequnce of bands, strings or a dictionary mapping names to bands
kwargs go into matplotlib.pyplot.plot() except for:
clear figure before plotting
show legend with band names
unit to use on plots (defaults to angstroms)
(do not use)
(do not use)
Compute the surface brightness given a half-light radius in arcsec. Note that the totalm is the integrated magnitude, not just the half-light
this uses a standard system to apply the zeropoints for the specified band names.
system can be: * ‘AB’ - use AB magnitudes * ‘vega’ - use vega=0 magnitudes based on Kurucz ‘93 Alpha Lyrae models * ‘vega##’ - use vega=## magnitudes based on Kurucz ‘93 Alpha Lyrae models
estimate color to effective temperature - currently only g-r is available from McGurk 10 or B-V from Flower 96
Uses UBVRI_to_ugriz() and ugriz_to_UBVRI() to transform a dictionary of magnitudes (or arrays of magnitudes) in one system into the other. The keys in the dictionary should be the name of the bands, while the values are the actual magnitudes. The computed magnitudes will then be added with keys matching the appropriate band name. This uses the Jester 2005 transformation equations.
| Parameters: |
|
|---|---|
| Raises ValueError: | |
If either both photometric systems or neither are present in the dictionary. |
|
This function transforms SDSS photometry to the UBVRcIc, using the transformations of Jester et al. (2005).
| Parameters: |
|
|---|---|
| Returns: | (u,g,r,i,z) magnitudes in the requested SDSS system as a tuple of scalars or arrays (depending on the type of the inputs) |